CV and sparsity
Joyce Hsiao
2015-10-07
Last updated: 2015-12-11
Code version: ba8f659f8899d05d9a13b626bda016c7d2389a16
Objective
Explore the relationship between coefficient of variation and sparsity.
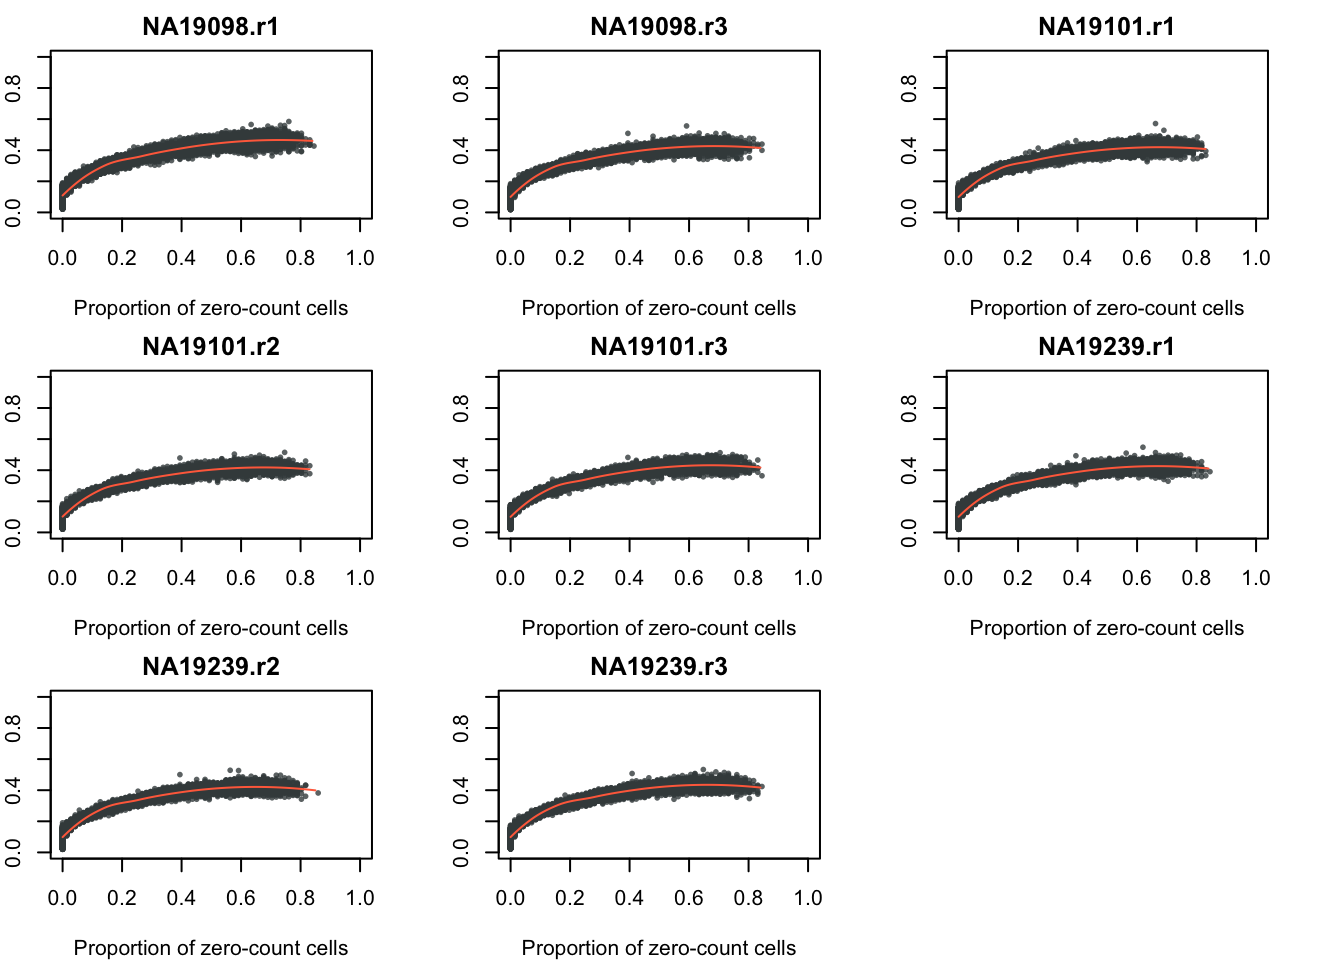
As expected, a large coefficient of variation is associated with a large number of zero-count cells in a gene, an observation that is consistent with an important feature of the count data where the coefficient of variation is large for genes with low expression levels.
Set up
library("data.table")
library("dplyr")
library("limma")
library("edgeR")
library("ggplot2")
library("grid")
theme_set(theme_bw(base_size = 12))
source("functions.R")

## Knitr settings
library(knitr)
opts_knit$set(progress = TRUE, verbose = TRUE)
opts_chunk$set(message = FALSE, warning = FALSE, eval = TRUE,
               echo = TRUE)
Prepare data
Input annotation of only QC-filtered single cells
anno_qc <- read.table("../data/annotation-filter.txt", header = TRUE,
                   stringsAsFactors = FALSE)
head(anno_qc)
individual replicate well batch sample_id
1 NA19098 r1 A01 NA19098.r1 NA19098.r1.A01
2 NA19098 r1 A02 NA19098.r1 NA19098.r1.A02
3 NA19098 r1 A04 NA19098.r1 NA19098.r1.A04
4 NA19098 r1 A05 NA19098.r1 NA19098.r1.A05
5 NA19098 r1 A06 NA19098.r1 NA19098.r1.A06
6 NA19098 r1 A07 NA19098.r1 NA19098.r1.A07Input molecule counts that are filtered, transformed, and also processed to remove unwanted variation from batch effet. ERCC genes are also removed.
molecules_qc <- read.table("../data/molecules-final.txt", header = TRUE, stringsAsFactors = FALSE)Compute coefficient of variation
Compute per batch coefficient of variation.
Include only genes with positive coefficient of variation. Some genes in this data may have zero coefficient of variation, because we include gene with more than 0 count across all cells.
molecules_cv_batch <-
  lapply(1:length(unique(anno_qc$batch)), function(per_batch) {
        molecules_per_batch <- molecules_qc[ , unique(anno_qc$batch) == unique(anno_qc$batch)[per_batch] ]
        mean_per_gene <- apply(molecules_per_batch, 1, mean, na.rm = TRUE)
        sd_per_gene <- apply(molecules_per_batch, 1, sd, na.rm = TRUE)
        cv_per_gene <- data.frame(mean = mean_per_gene,
                                  sd = sd_per_gene,
                                  cv = sd_per_gene/mean_per_gene)
        rownames(cv_per_gene) <- rownames(molecules_qc)

        cv_per_gene <- cv_per_gene[rowSums(is.na(cv_per_gene)) == 0, ]
        cv_per_gene$batch <- unique(anno_qc$batch)[per_batch]
        return(cv_per_gene)
      })
names(molecules_cv_batch) <- unique(anno_qc$batch)

dim(molecules_cv_batch[[1]])
[1] 10564 4Sparsity
Import molecule count file before normlization.
molecules_filter <- read.table("../data/molecules-filter.txt")

select_nonERCC <- grep("ERCC", rownames(molecules_filter), invert = TRUE)
molecules_ENSG <- molecules_filter[select_nonERCC, ]

stopifnot(dim(molecules_ENSG) == dim(molecules_qc))
Compute the proportion of zero count cells in each gene.
per_batch = 2
molecules_sparse_batch <-
  lapply(1:length(unique(anno_qc$batch)), function(per_batch) {
        sparse_per_batch <- molecules_ENSG[ , unique(anno_qc$batch) == unique(anno_qc$batch)[per_batch] ]
        sparse_per_gene <- apply(sparse_per_batch, 1, function(x) {
                                  mean(x == 0)
                                })
        return(sparse_per_gene)
      })
names(molecules_sparse_batch) <- unique(anno_qc$batch)
str(molecules_sparse_batch[[1]])
Named num [1:10564] 0.7042 0.3239 0.2676 0.0423 0.2535 ...
- attr(*, "names")= chr [1:10564] "ENSG00000237683" "ENSG00000188976" "ENSG00000187608" "ENSG00000188157" ...str(molecules_sparse_batch[[2]]) Named num [1:10564] 0.7324 0.2113 0.1831 0.0141 0.2958 ...
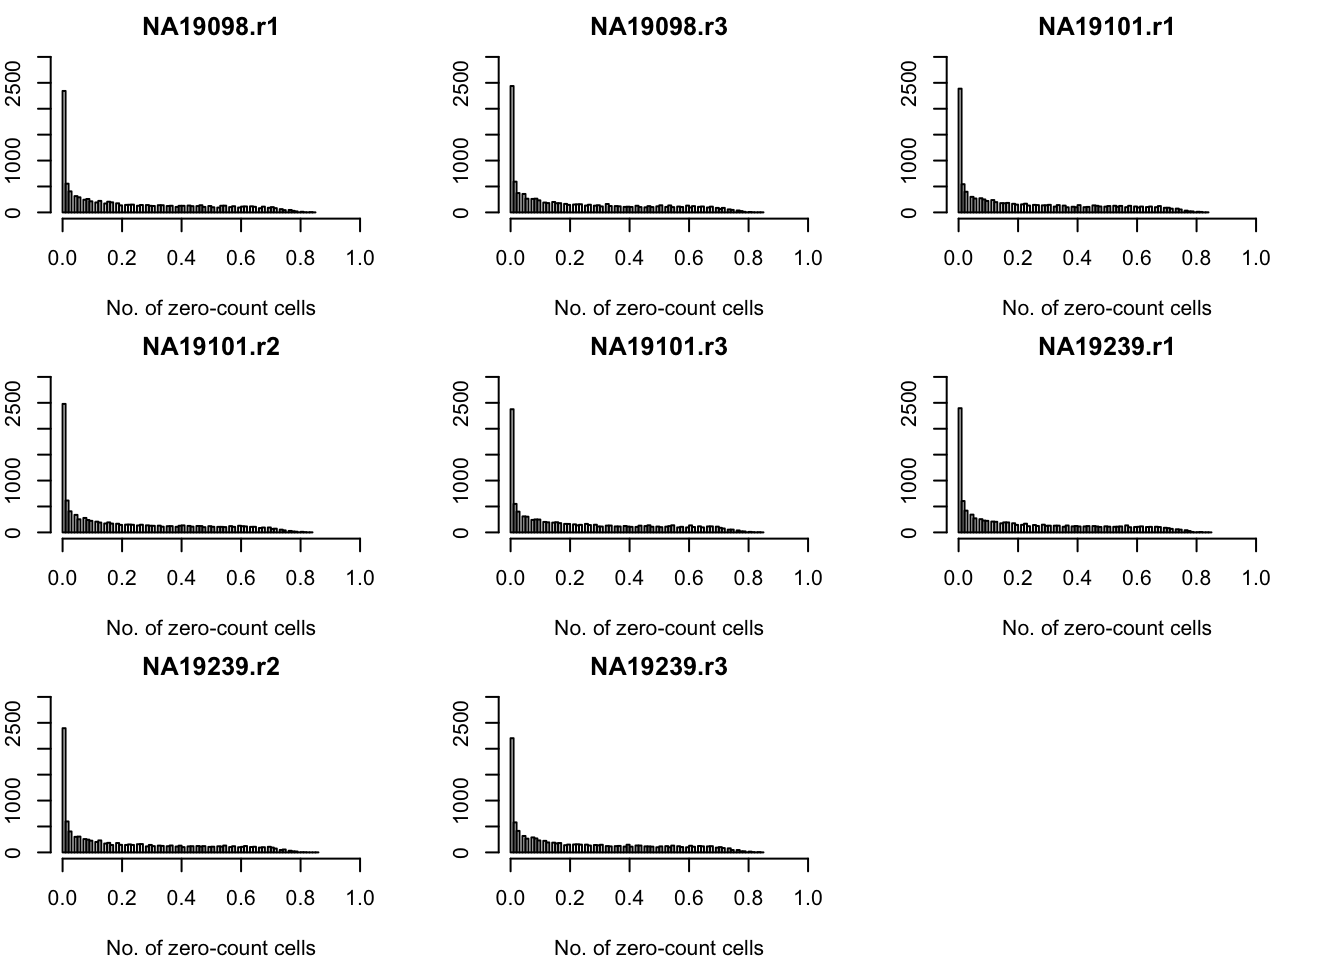
- attr(*, "names")= chr [1:10564] "ENSG00000237683" "ENSG00000188976" "ENSG00000187608" "ENSG00000188157" ...Frequency of zero-count cell proportions.
par(mfrow = c(3,3), mar = c(4,2,2,3))
for (per_batch in 1:length(unique(anno_qc$batch))) {
  hist( molecules_sparse_batch[[per_batch]],
        main = unique(anno_qc$batch)[per_batch], breaks = 100,
        ylim = c(0, 3000), xlim = c(0, 1),
        xlab = "No. of zero-count cells")
}
CV and sparsity
require(broman)
require(scales)
crayons <- brocolors("crayon")
par(mfrow = c(3,3), mar = c(4,2,2,3))
for (per_batch in 1:length(unique(anno_qc$batch))) {
  df_xy <- data.frame(x = molecules_sparse_batch[[per_batch]],
                      y = molecules_cv_batch[[per_batch]]$cv)
  plot(df_xy,
       xlab = "Proportion of zero-count cells",
       ylab = "CV",
       xlim = c(0, 1), ylim = c(0, 1),
       main = unique(anno_qc$batch)[per_batch],
       cex = .6, pch = 16, col = alpha(crayons["Outer Space"], .8))
  loess_fit <- loess(y ~ x, df_xy)
  x_seq <- with(df_xy, seq(min(x), max(x), by = .01))
  lines(x_seq,
        predict(loess_fit, x_seq),
        col = crayons["Outrageous Orange"],
        lwd = 1)
}
Session information
sessionInfo()R version 3.2.1 (2015-06-18)
Platform: x86_64-apple-darwin13.4.0 (64-bit)
Running under: OS X 10.10.5 (Yosemite)
locale:
[1] en_US.UTF-8/en_US.UTF-8/en_US.UTF-8/C/en_US.UTF-8/en_US.UTF-8
attached base packages:
[1] grid stats graphics grDevices utils datasets methods
[8] base
other attached packages:
[1] scales_0.3.0 broman_0.59-5 ggplot2_1.0.1 edgeR_3.10.5
[5] limma_3.24.15 dplyr_0.4.3 data.table_1.9.6 knitr_1.11
loaded via a namespace (and not attached):
[1] Rcpp_0.12.2 magrittr_1.5 MASS_7.3-45 munsell_0.4.2
[5] colorspace_1.2-6 R6_2.1.1 stringr_1.0.0 plyr_1.8.3
[9] tools_3.2.1 parallel_3.2.1 gtable_0.1.2 DBI_0.3.1
[13] htmltools_0.2.6 yaml_2.1.13 assertthat_0.1 digest_0.6.8
[17] reshape2_1.4.1 formatR_1.2.1 evaluate_0.8 rmarkdown_0.8.1
[21] stringi_1.0-1 chron_2.3-47 proto_0.3-10