Subsample: Cell to cell variance in expression
2015-07-16
Last updated: 2015-07-27
Code version: 07ed76a5f8f8bbe62a779ba8ca9585699887eced
How does cell to cell variance in gene expression varies with subsampling both sequencing depth and number of cells? To do this I calculated the variance for each gene using all the single cells available for a given individual at a given sequencing depth and then compared these to the estimates from a random subsample of cells. I log-tranformed the values (plus a pseudocount of 0.25 to avoid dividing by zero) and then calculated the Pearson’s r and the root-mean-square error (RMSE).
library("dplyr")
library("ggplot2")
theme_set(theme_bw(base_size = 14))
Batch process each subsampled data set
Run 10 iterations for each individual for each sequencing depth for each subsample of cells. The analysis is performed by subsample-variance.R.
cd $ssd/subsampled
mkdir -p variance variance-quantiles
mkdir -p ~/log/subsample-variance.R
for IND in 19098 19101 19239
do
  for NUM in 200000 400000 1000000 2000000 3000000 4000000
  do
    for CELLS in 5 10 15 20 25 50 75 100 125 150
    do
      for SEED in {1..10}
      do
        # For all genes
        ## Molecules
        CMD="subsample-variance.R $CELLS $SEED molecule-counts-$NUM.txt --individual=$IND --min_count=1 --min_cells=5 --good_cells=/mnt/lustre/home/jdblischak/singleCellSeq/data/quality-single-cells.txt"
        DEST="variance/molecule-$IND-$CELLS-$SEED-$NUM.txt"
        echo "$CMD > $DEST" | qsub -l h_vmem=2g -cwd -V -N variance-molecule-$IND-$CELLS-$SEED-$NUM -j y -o ~/log/subsample-variance.R -l 'hostname=!bigmem01'
        sleep .01s
        ## Reads
        CMD="subsample-variance.R $CELLS $SEED read-counts-$NUM.txt --individual=$IND --min_count=10 --min_cells=5 --good_cells=/mnt/lustre/home/jdblischak/singleCellSeq/data/quality-single-cells.txt"
        DEST="variance/read-$IND-$CELLS-$SEED-$NUM.txt"
        echo "$CMD > $DEST" | qsub -l h_vmem=2g -cwd -V -N variance-read-$IND-$CELLS-$SEED-$NUM -j y -o ~/log/subsample-variance.R -l 'hostname=!bigmem01'
        sleep .01s
        # For quantiles
        ## Molecules
        CMD="subsample-variance.R $CELLS $SEED molecule-counts-$NUM.txt --individual=$IND --min_count=1 --min_cells=5 --good_cells=/mnt/lustre/home/jdblischak/singleCellSeq/data/quality-single-cells.txt -q .25 -q .5 -q .75"
        DEST="variance-quantiles/molecule-$IND-$CELLS-$SEED-$NUM.txt"
        echo "$CMD > $DEST" | qsub -l h_vmem=2g -cwd -V -N variance-molecule-$IND-$CELLS-$SEED-$NUM-quantiles -j y -o ~/log/subsample-variance.R -l 'hostname=!bigmem01'
        sleep .01s
        ## Reads
        CMD="subsample-variance.R $CELLS $SEED read-counts-$NUM.txt --individual=$IND --min_count=10 --min_cells=5 --good_cells=/mnt/lustre/home/jdblischak/singleCellSeq/data/quality-single-cells.txt -q .25 -q .5 -q .75"
        DEST="variance-quantiles/read-$IND-$CELLS-$SEED-$NUM.txt"
        echo "$CMD > $DEST" | qsub -l h_vmem=2g -cwd -V -N variance-read-$IND-$CELLS-$SEED-$NUM-quantiles -j y -o ~/log/subsample-variance.R -l 'hostname=!bigmem01'
        sleep .01s
      done
    done
  done
done
Convert to one file using Python. Run from $ssd/subsampled.
import os
import glob

def gather(files, outfile):
    out = open(outfile, "w")
    out.write("type\tind\tdepth\tnum_cells\tseed\ttotal_cells\tr\trmse\tquantiles\tnum_genes\n")
    for fname in files:
        fname_parts = os.path.basename(fname).rstrip(".txt").split("-")
        type = fname_parts[0]
        ind = fname_parts[1]
        depth = fname_parts[4]
        f = open(fname, "r")
        for line in f:
            out.write(type + "\t" + ind + "\t" + depth + "\t" + line)
        f.close()
    out.close()

files = glob.glob("variance/*txt")
gather(files, "variance.txt")

files = glob.glob("variance-quantiles/*txt")
gather(files, "variance-quantiles.txt")
Input data
Full data
var_data <- read.table("/mnt/gluster/data/internal_supp/singleCellSeq/subsampled/variance.txt",
                         header = TRUE, sep = "\t", stringsAsFactors = FALSE)
Calculate the mean and standard error of the mean (sem) for each of the 10 iterations.
var_data_plot <- var_data %>%
  group_by(type, ind, depth, num_cells, total_cells) %>%
  summarize(r_mean = mean(r), r_sem = sd(r) / sqrt(length(r)),
            rmse_mean = mean(rmse), rmse_sem = sd(rmse) / sqrt(length(rmse)),
            num_genes = num_genes[1])
For the analysis of read counts, a gene was included if it had greater than 10 reads in at least 5 cells. For the analysis of molecule counts, a gene was included if it had greater than 1 molecule in at least 5 cells.
Quantiles
var_data_q <- read.table("/mnt/gluster/data/internal_supp/singleCellSeq/subsampled/variance-quantiles.txt",
                         header = TRUE, sep = "\t", stringsAsFactors = FALSE)
Calculate the mean and standard error of the mean (sem) for each of the 10 iterations.
var_data_plot_q <- var_data_q %>%
  group_by(type, ind, depth, num_cells, total_cells, quantiles) %>%
  summarize(r_mean = mean(r), r_sem = sd(r) / sqrt(length(r)),
            rmse_mean = mean(rmse), rmse_sem = sd(rmse) / sqrt(length(rmse)),
            num_genes = num_genes[1])
Some single cells did not have enough reads for the higher subsamples.
var_data_plot_q <- na.omit(var_data_plot_q)Pearson’s r
Full data
p_r <- ggplot(var_data_plot, aes(x = num_cells, y = r_mean, color = as.factor(depth))) +
  geom_line() +
  geom_errorbar(aes(ymin = r_mean - r_sem, ymax = r_mean + r_sem), width = 1) +
  facet_grid(type~ind) +
  labs(x = "Number of subsampled cells",
       y = "Pearson's r",
       color = "Depth",
       title = "Subsample: Correlation of variance estimates")
p_r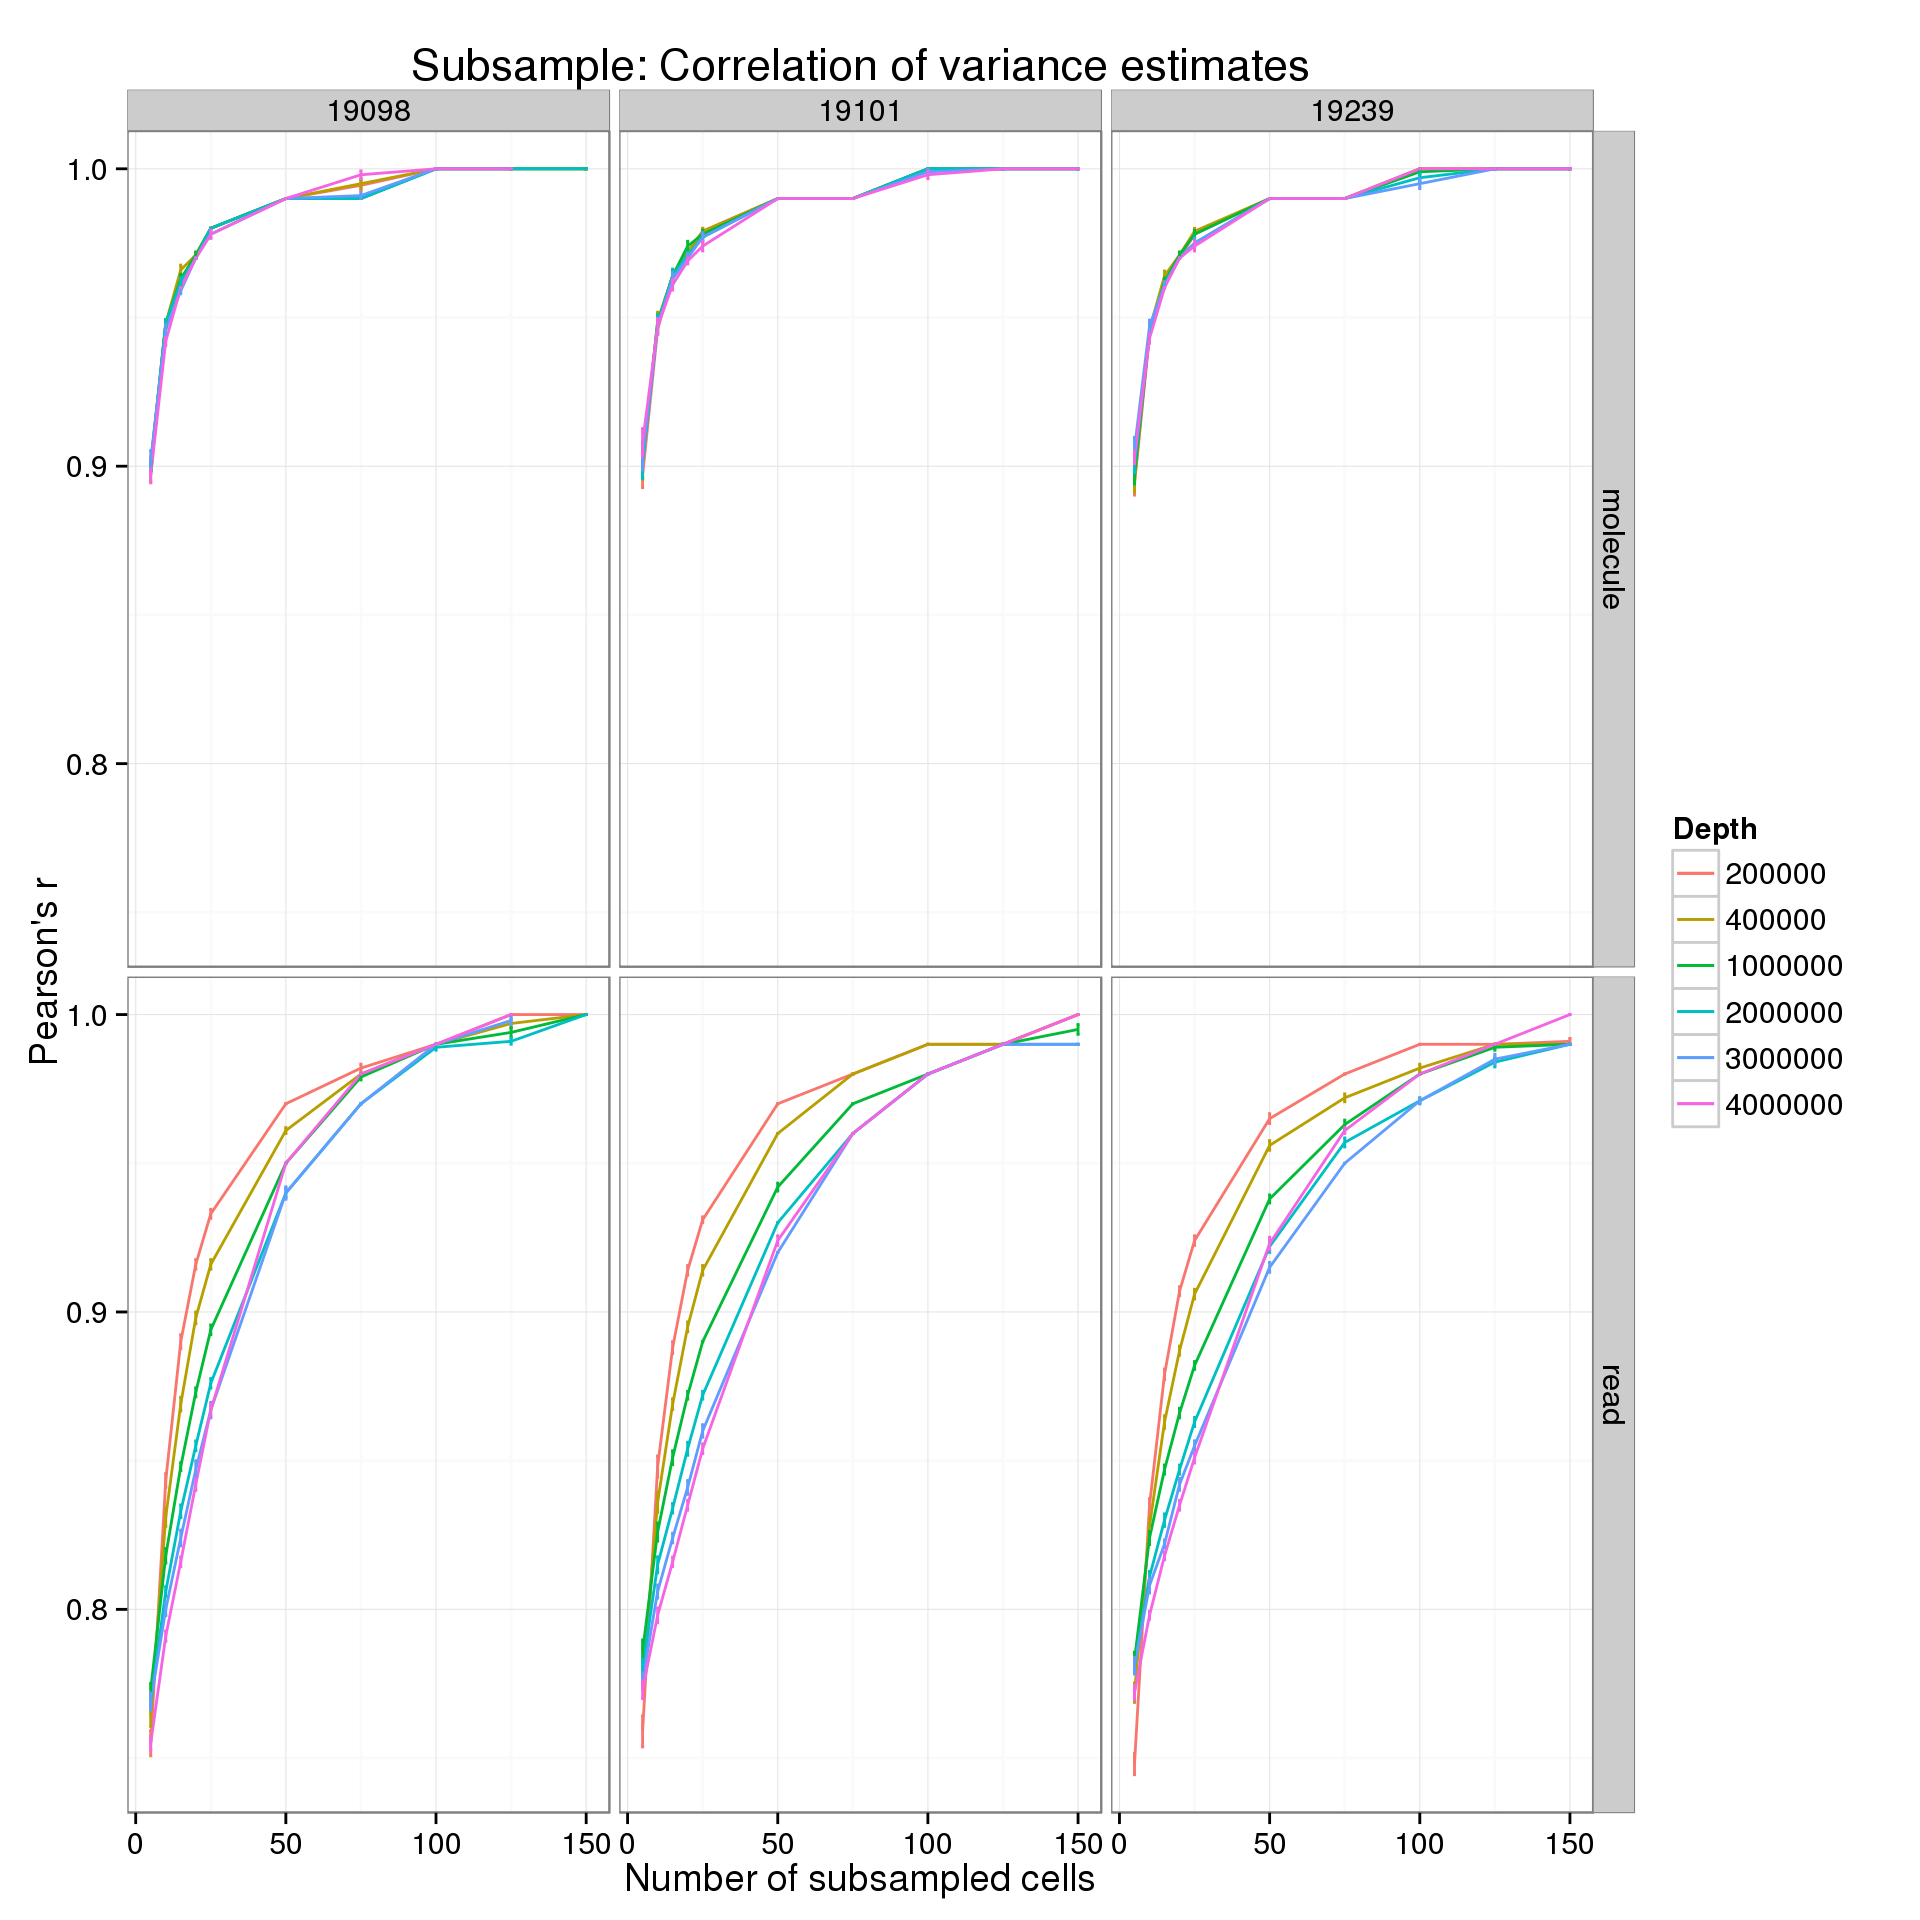
Quantiles
First for the molecules:
p_r_q_mol <- ggplot(var_data_plot_q[var_data_plot_q$type == "molecule", ],
              aes(x = num_cells, y = r_mean, color = as.factor(depth))) +
  geom_line() +
  geom_errorbar(aes(ymin = r_mean - r_sem, ymax = r_mean + r_sem), width = 1) +
  facet_grid(quantiles~ind) +
  labs(x = "Number of subsampled cells",
       y = "Pearson's r",
       color = "Depth",
       title = "Subsample: Correlation of variance estimates of molecules by expression level")
p_r_q_mol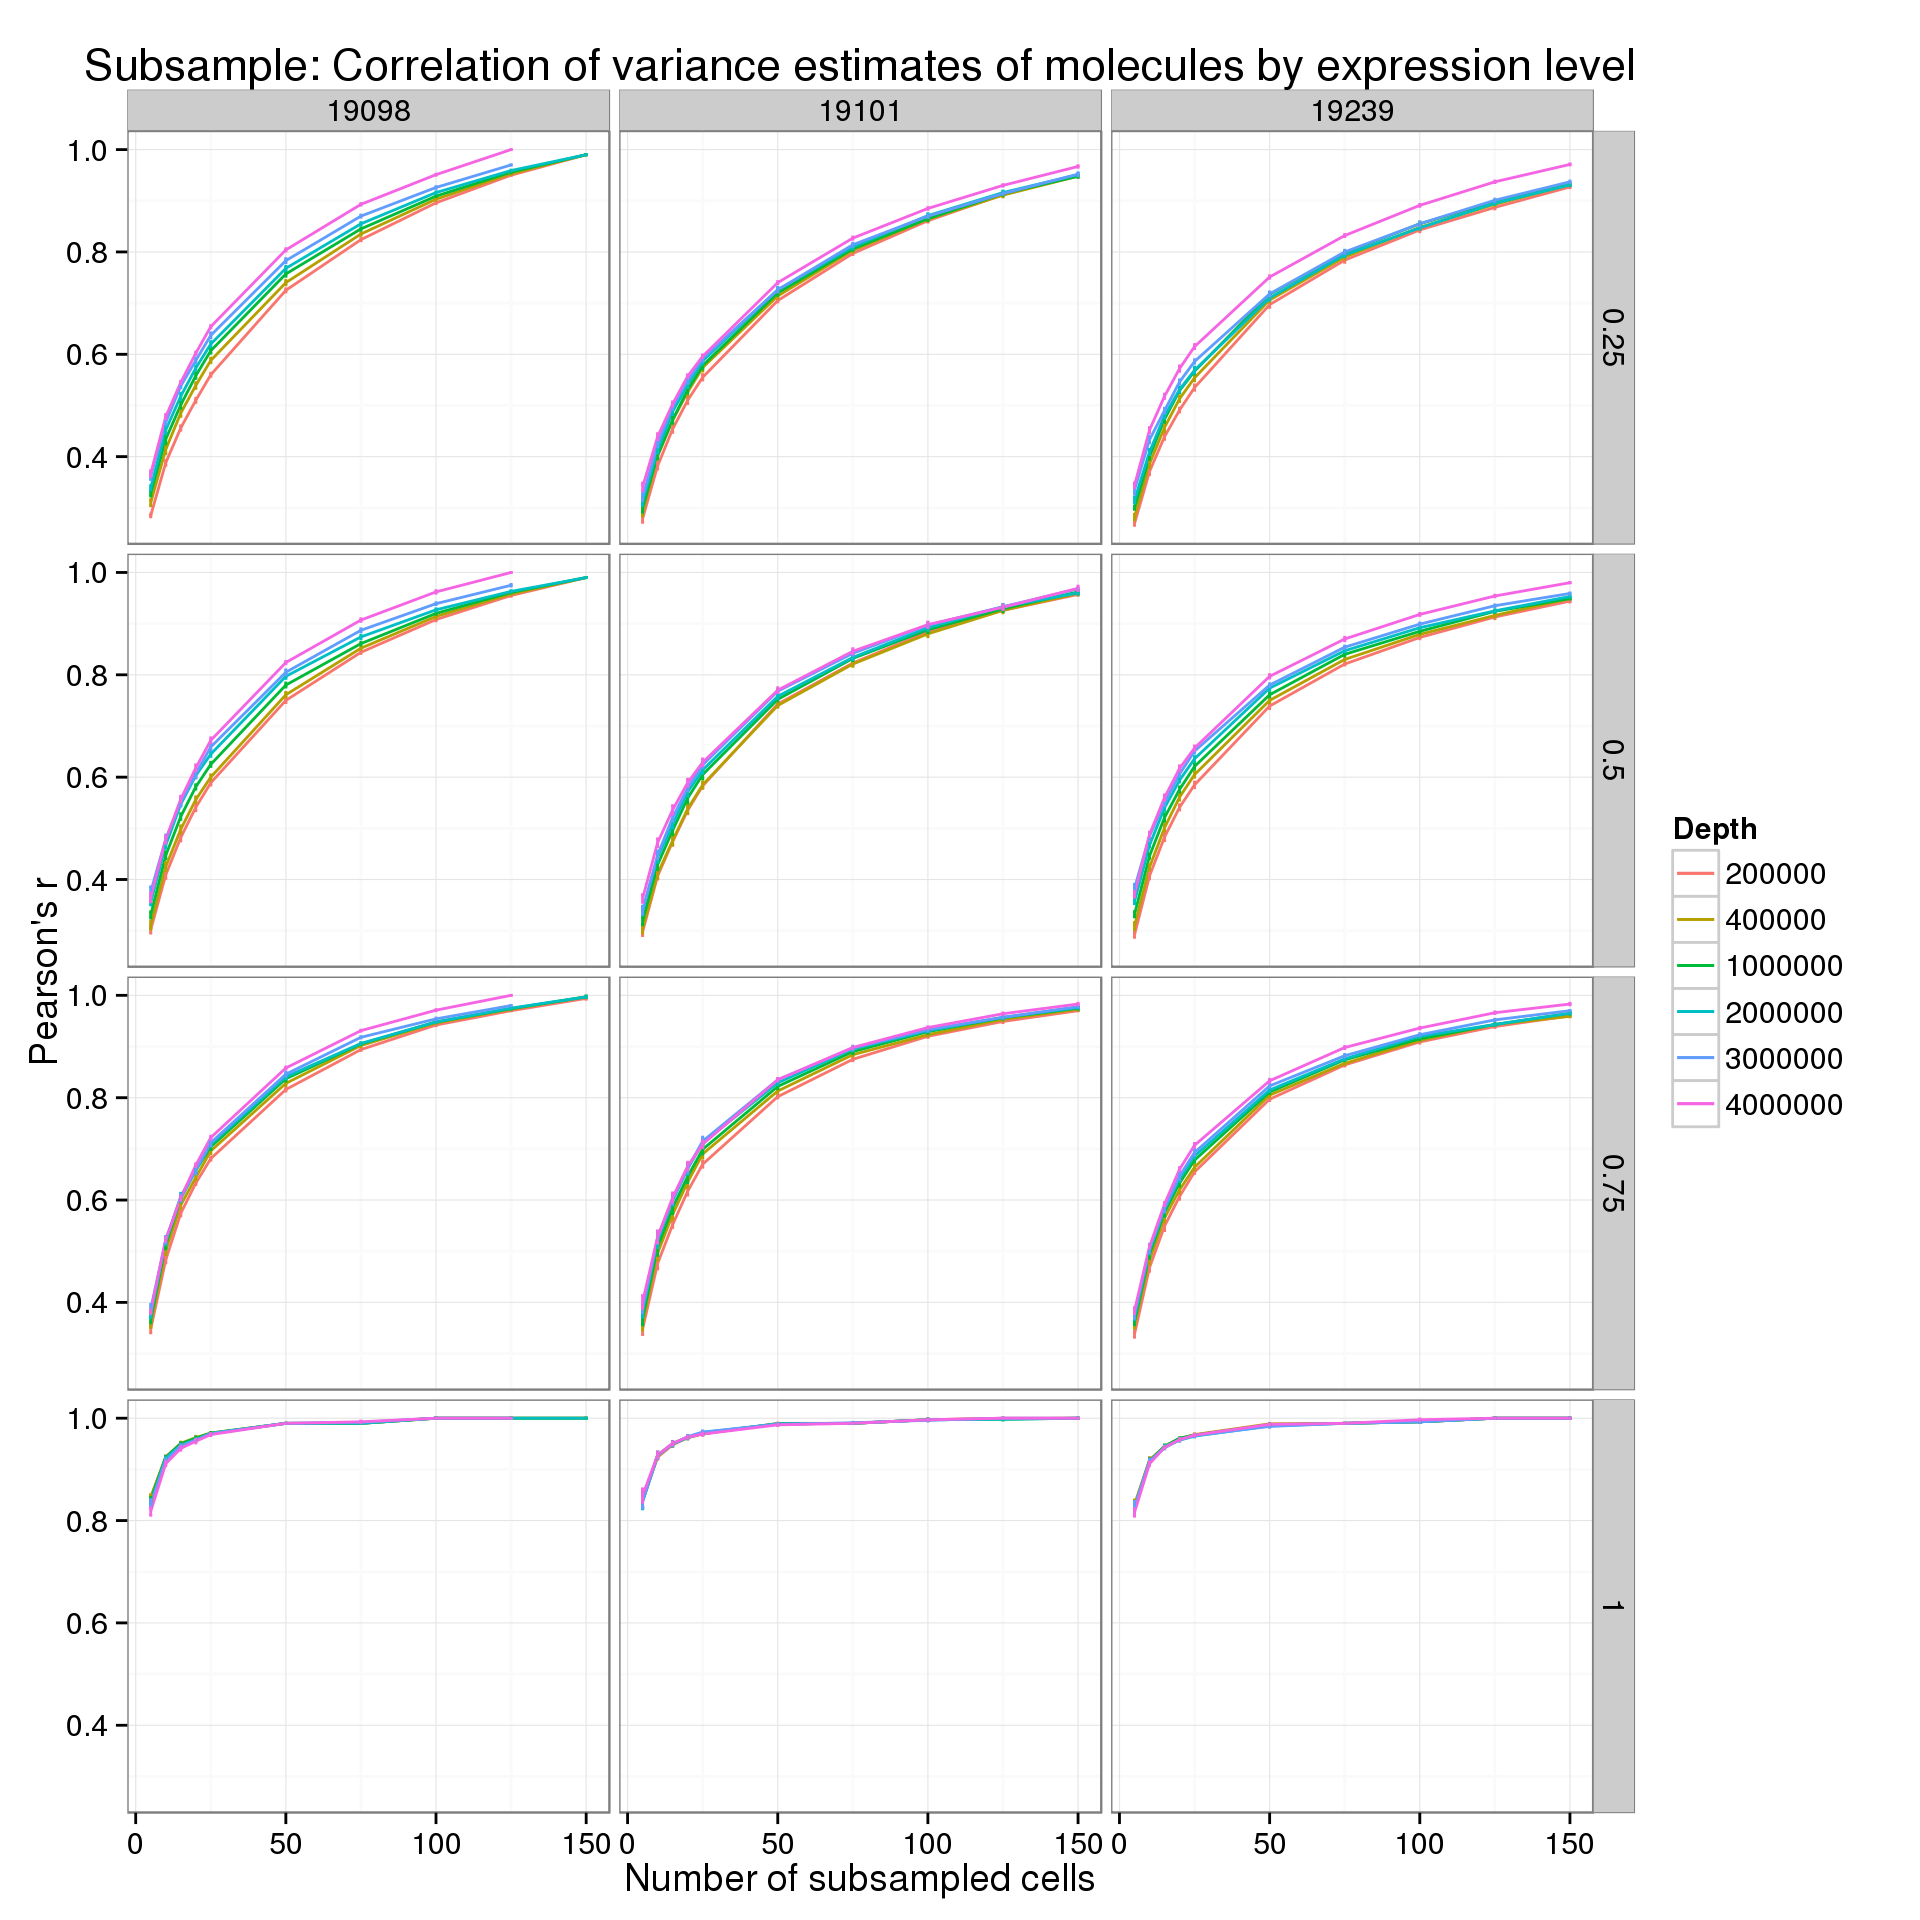
Second for the reads:
p_r_q_read <- ggplot(var_data_plot_q[var_data_plot_q$type == "read", ],
              aes(x = num_cells, y = r_mean, color = as.factor(depth))) +
  geom_line() +
  geom_errorbar(aes(ymin = r_mean - r_sem, ymax = r_mean + r_sem), width = 1) +
  facet_grid(quantiles~ind) +
  labs(x = "Number of subsampled cells",
       y = "Pearson's r",
       color = "Depth",
       title = "Subsample: Correlation of variance estimates of reads by expression level")
p_r_q_read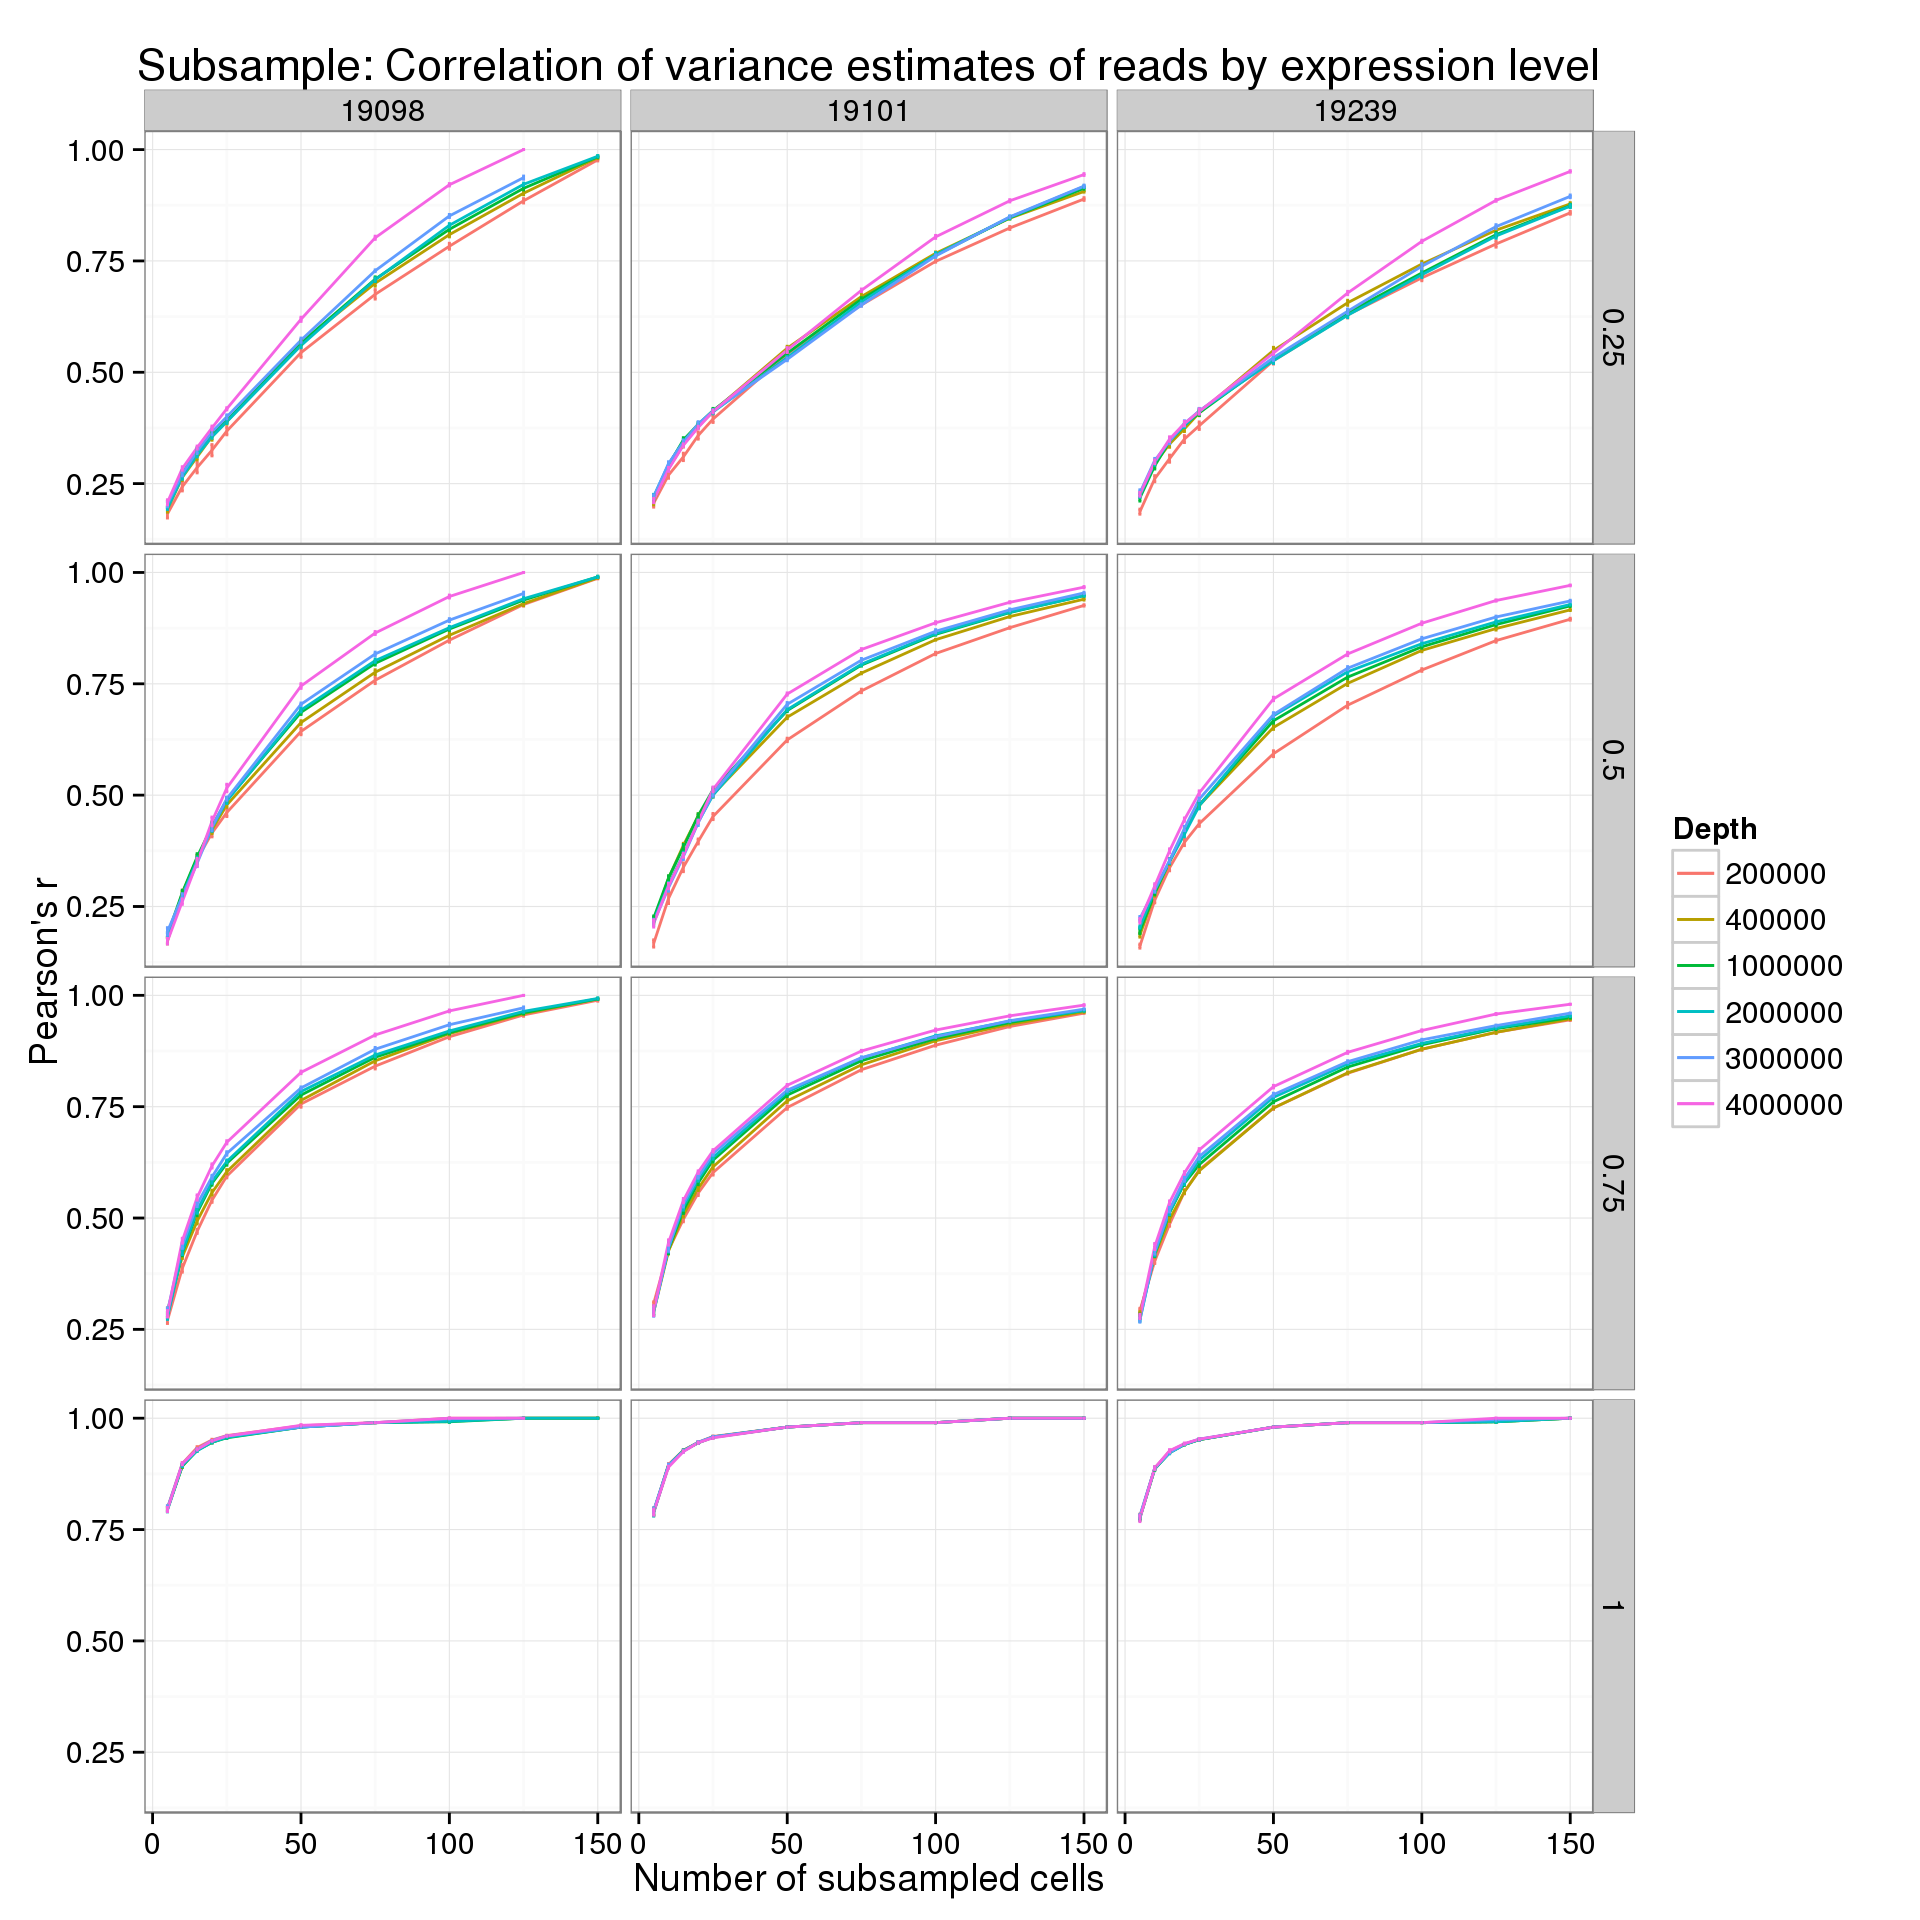
Root-mean-square error
Full data
p_rmse <- ggplot(var_data_plot, aes(x = num_cells, y = rmse_mean, color = as.factor(depth))) +
  geom_line() +
  geom_errorbar(aes(ymin = rmse_mean - rmse_sem, ymax = rmse_mean + rmse_sem), width = 1) +
  facet_grid(type~ind) +
  labs(x = "Number of subsampled cells",
       y = "Root-mean-square error",
       color = "Depth",
       title = "Subsample: RMSE of variance estimates")
p_rmse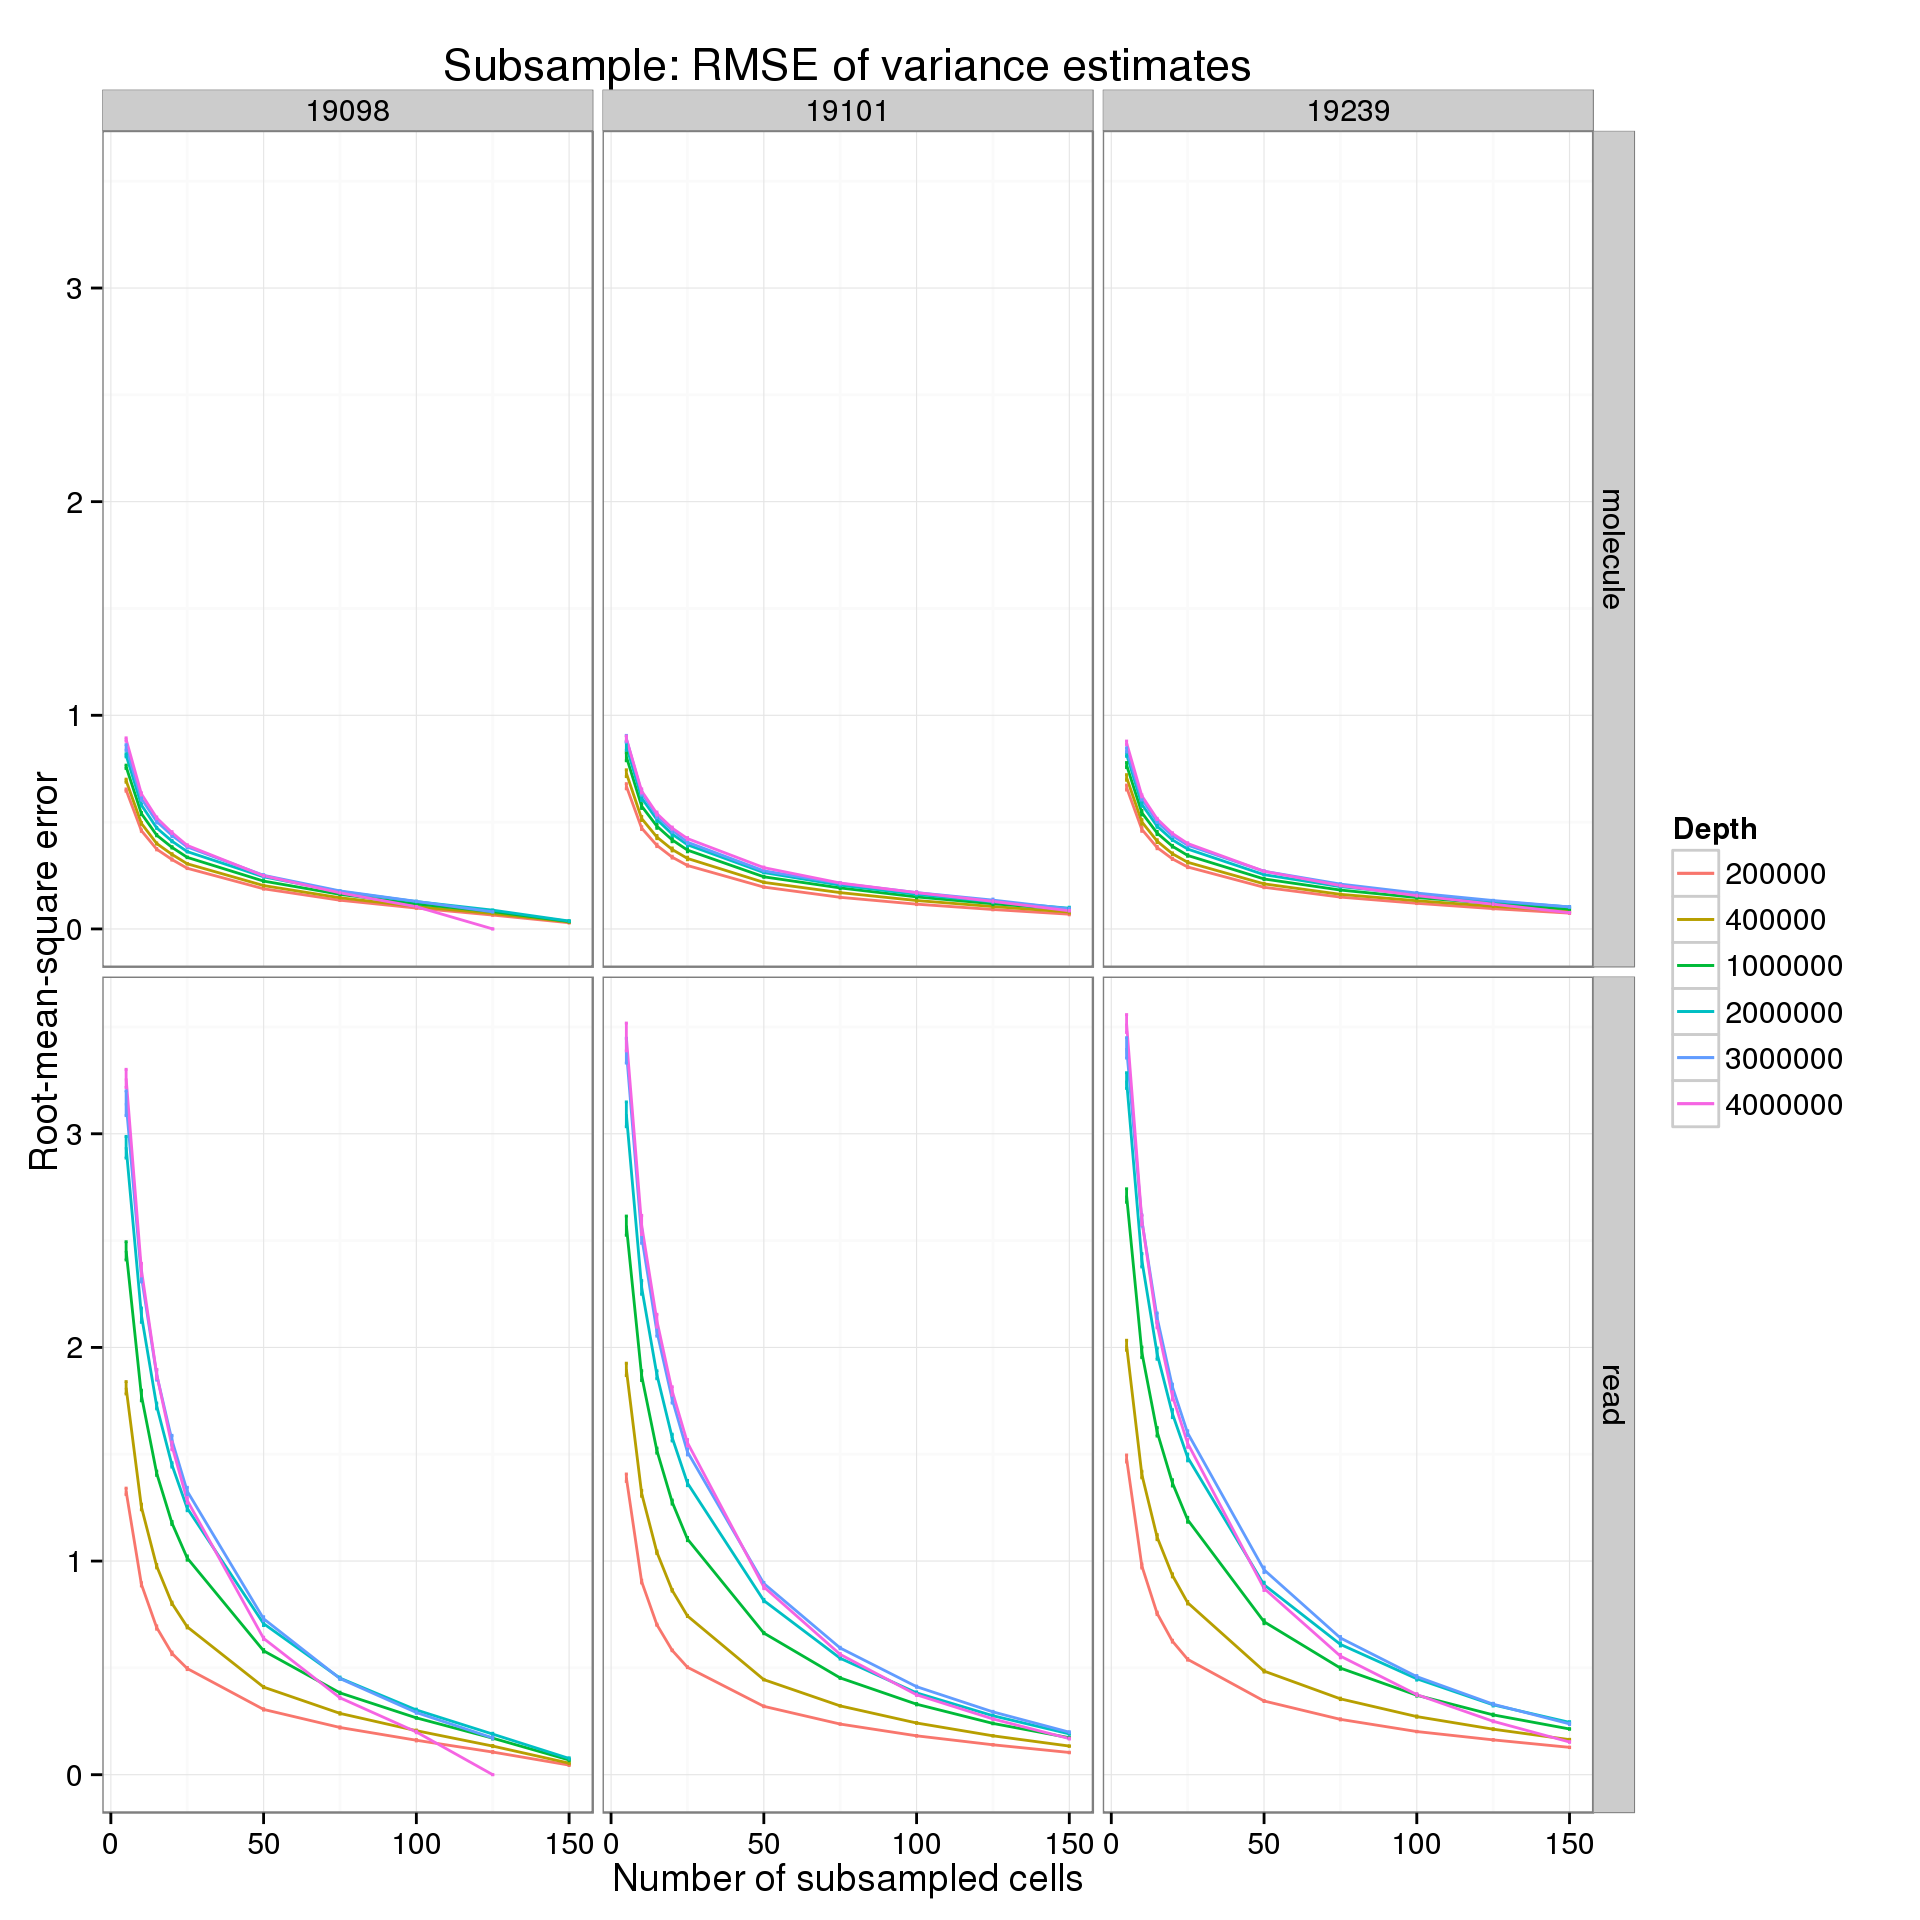
Quantiles
First for the molecules:
p_rmse_q_mol <- ggplot(var_data_plot_q[var_data_plot_q$type == "molecule", ],
                       aes(x = num_cells, y = rmse_mean, color = as.factor(depth))) +
  geom_line() +
  geom_errorbar(aes(ymin = rmse_mean - rmse_sem, ymax = rmse_mean + rmse_sem), width = 1) +
  facet_grid(quantiles~ind) +
  labs(x = "Number of subsampled cells",
       y = "Root-mean-square error",
       color = "Depth",
       title = "Subsample: RMSE of variance estimates of molecules by expression level")
p_rmse_q_mol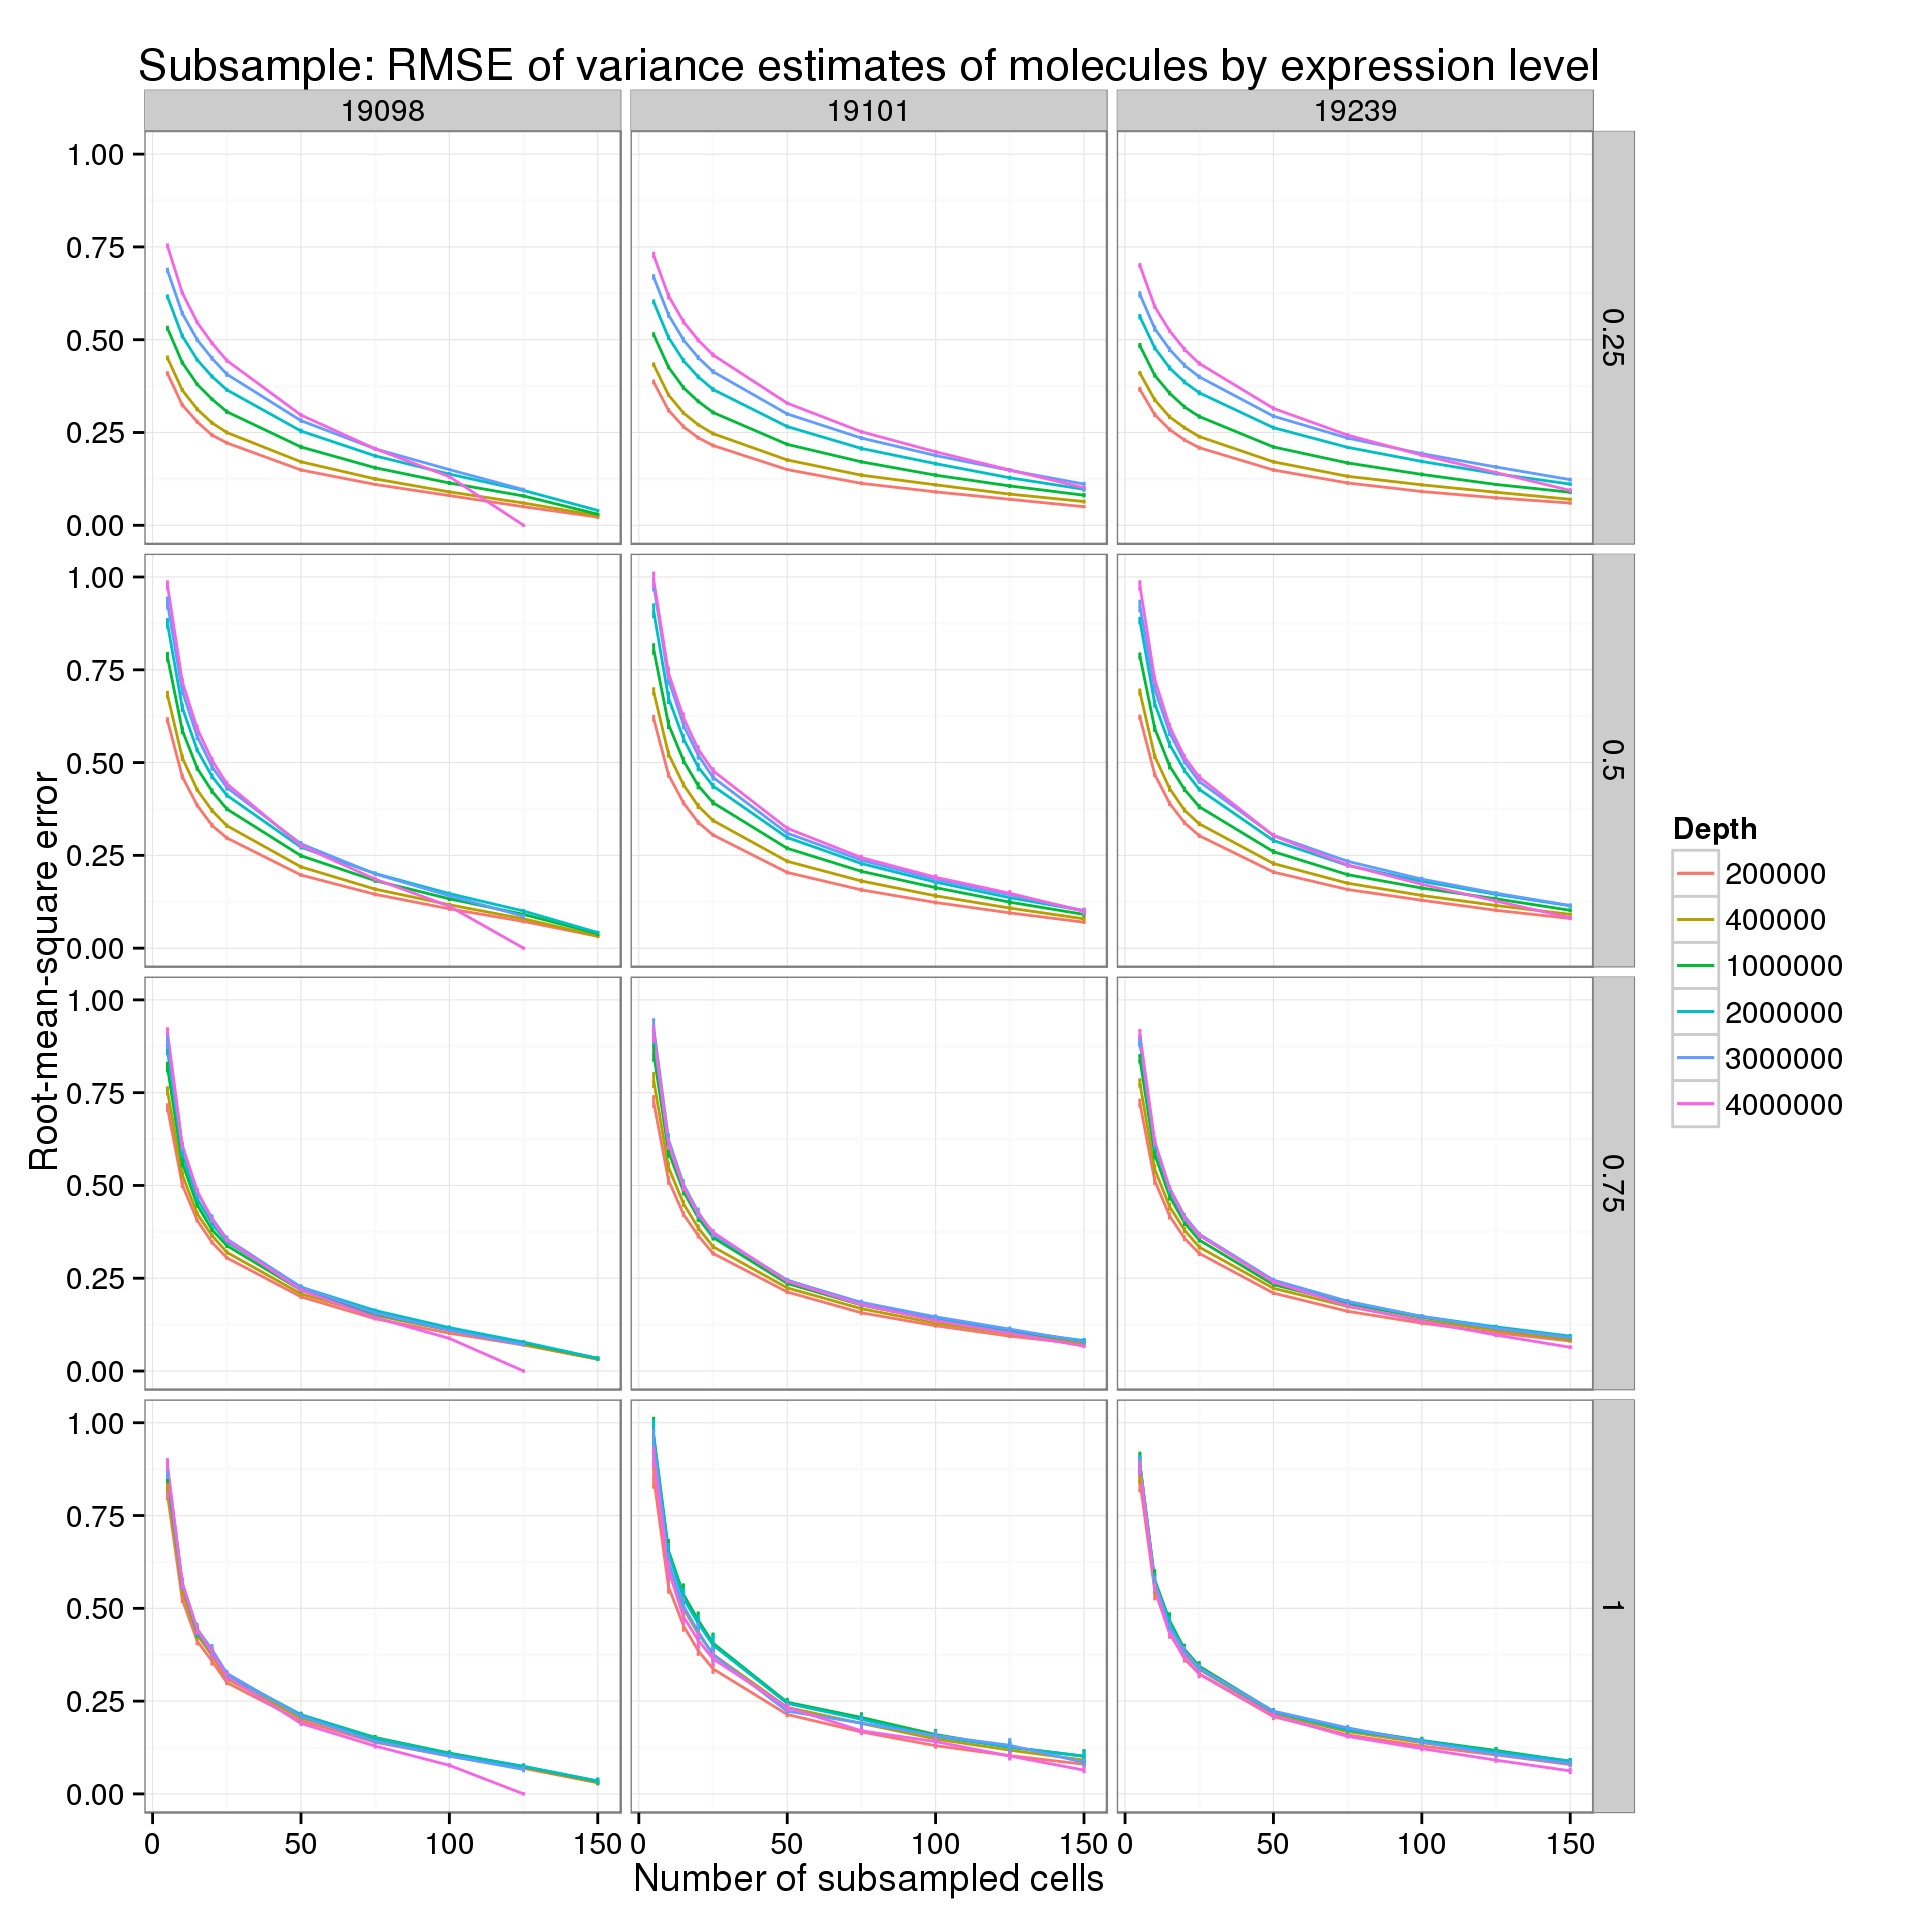
Second for the reads:
p_rmse_q_read <- ggplot(var_data_plot_q[var_data_plot_q$type == "read", ],
                       aes(x = num_cells, y = rmse_mean, color = as.factor(depth))) +
  geom_line() +
  geom_errorbar(aes(ymin = rmse_mean - rmse_sem, ymax = rmse_mean + rmse_sem), width = 1) +
  facet_grid(quantiles~ind) +
  labs(x = "Number of subsampled cells",
       y = "Root-mean-square error",
       color = "Depth",
       title = "Subsample: RMSE of variance estimates of reads by expression level")
p_rmse_q_read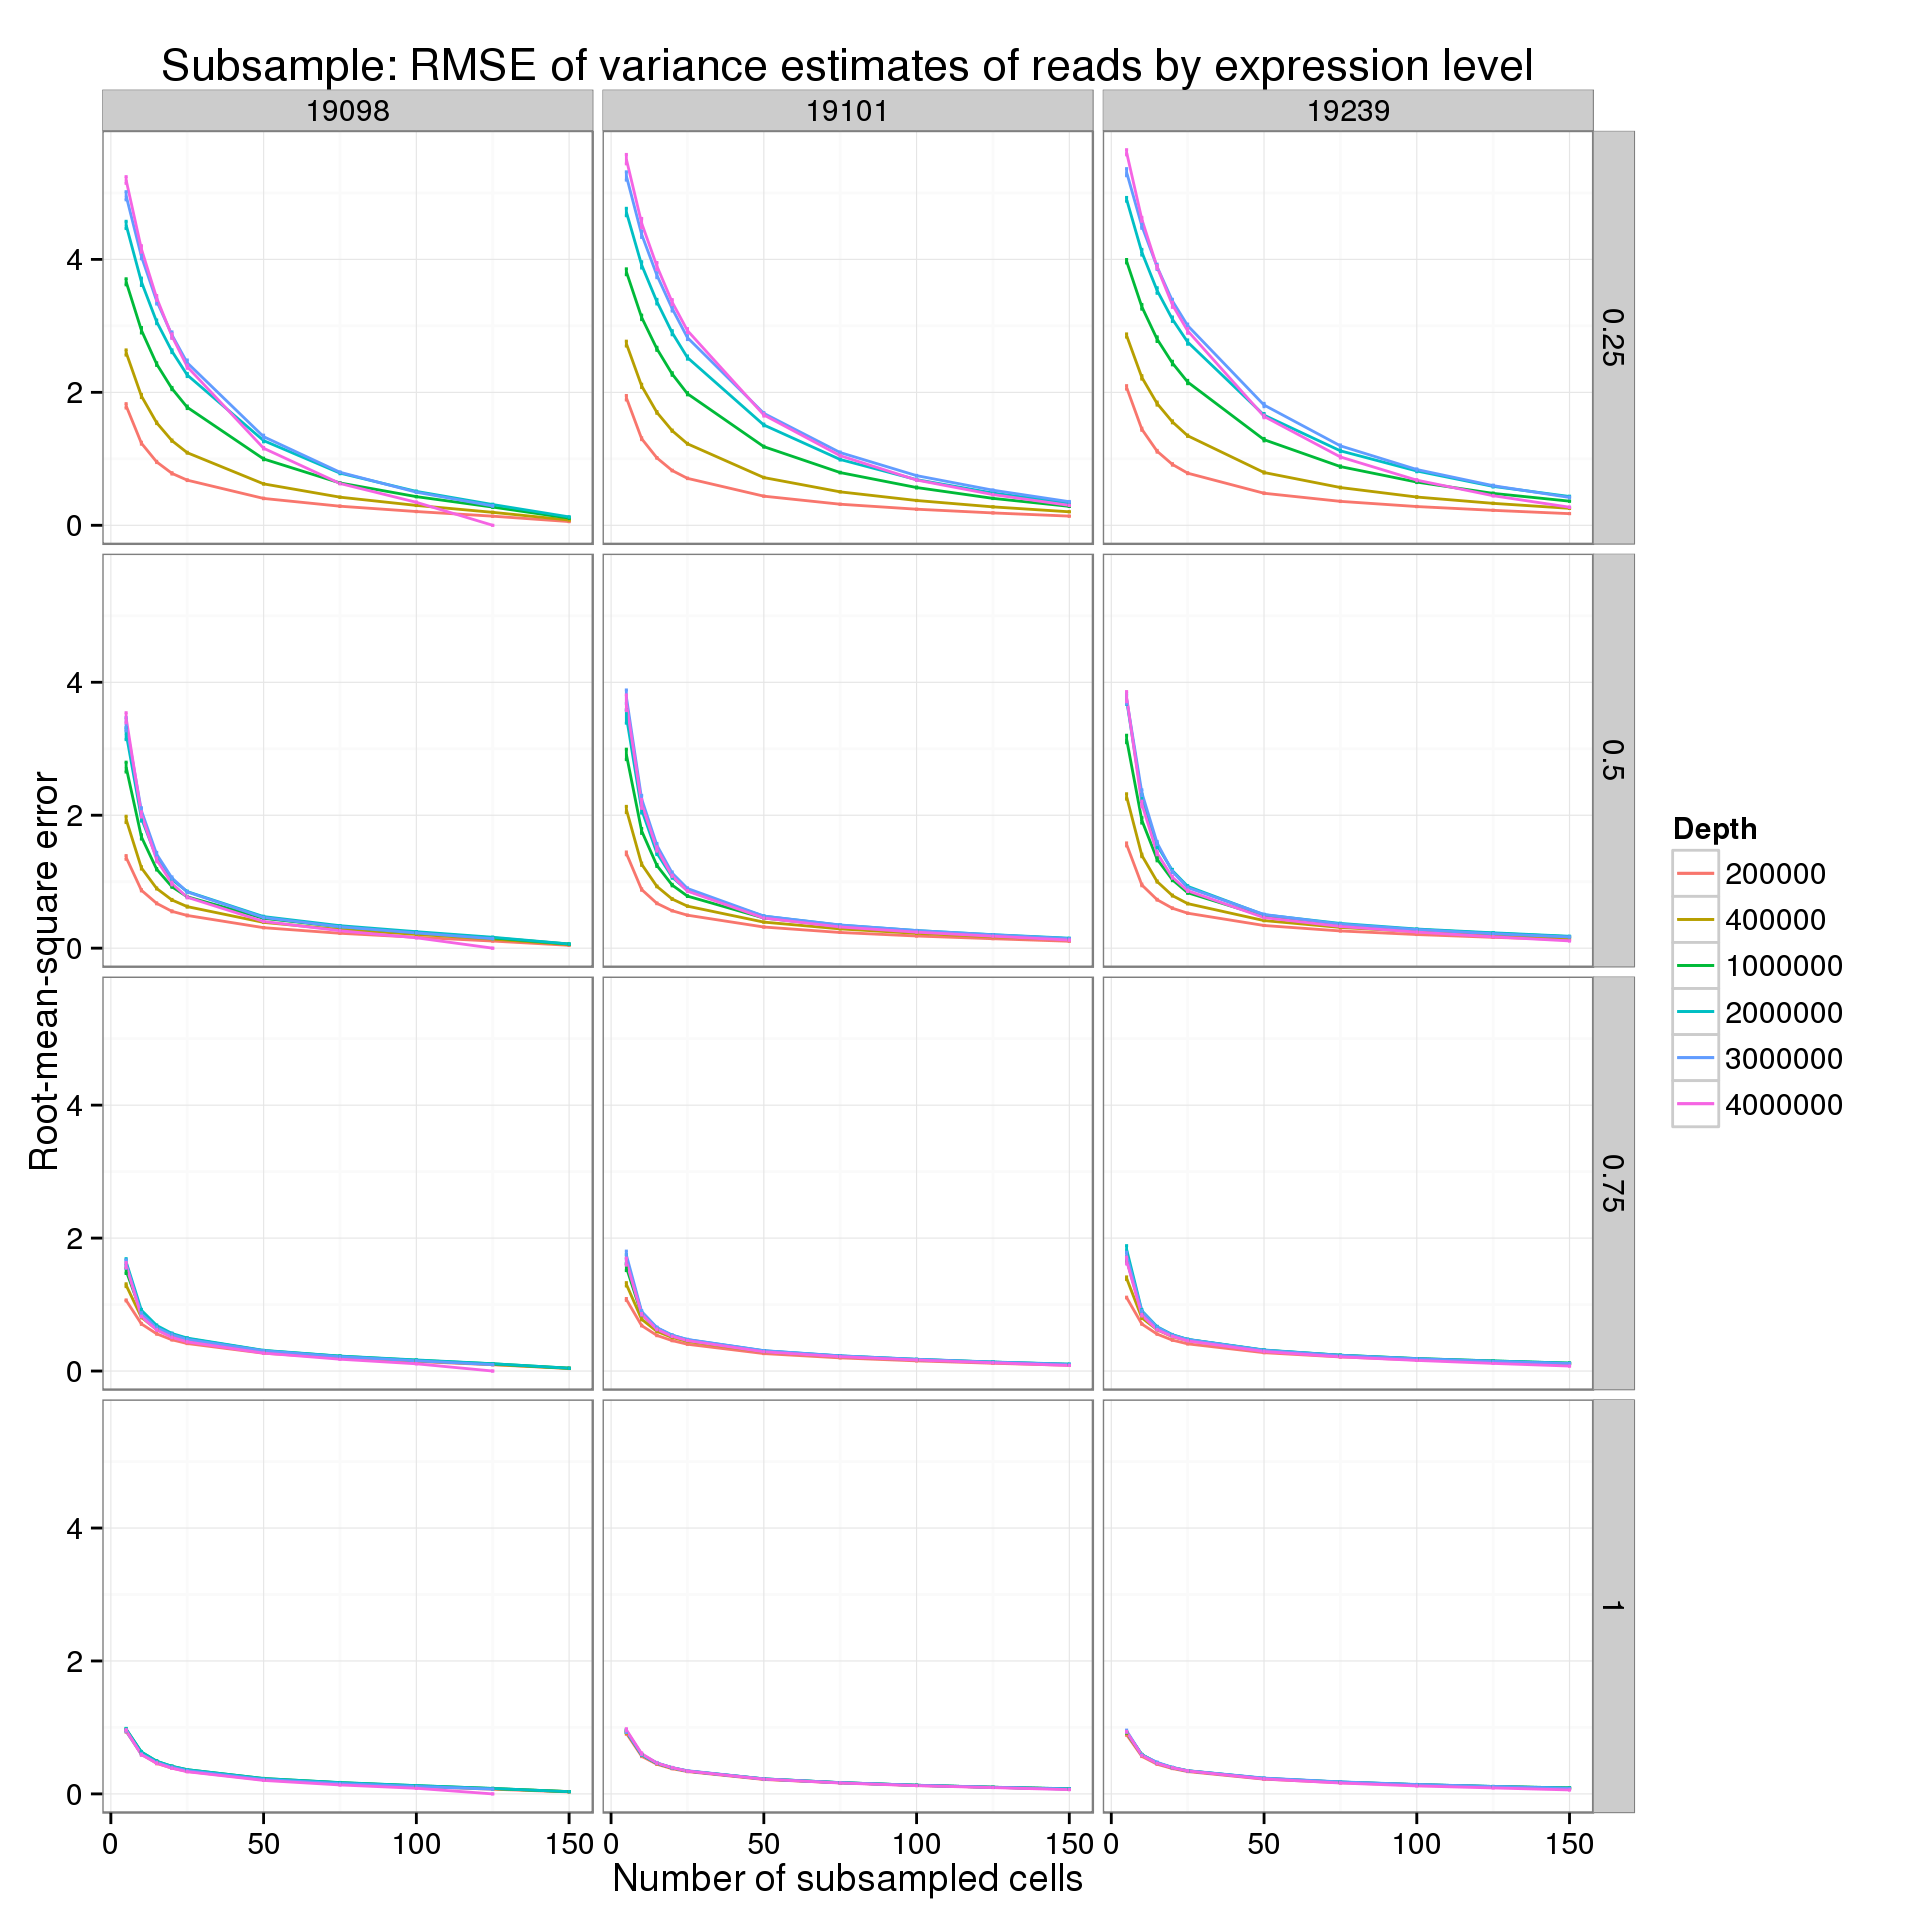
Effect of read depth on total number of cells
One thing to keep in mind is that the total number of cells used to calculate the “true” variance varies by sequencing depth.
ggplot(var_data_plot, aes(x = depth, y = total_cells)) +
  geom_point() +
  facet_grid(~ind) +
  labs(x = "Sequencing depth",
       y = "Total number of cells",
       title = "Effect of read depth on total number of cells")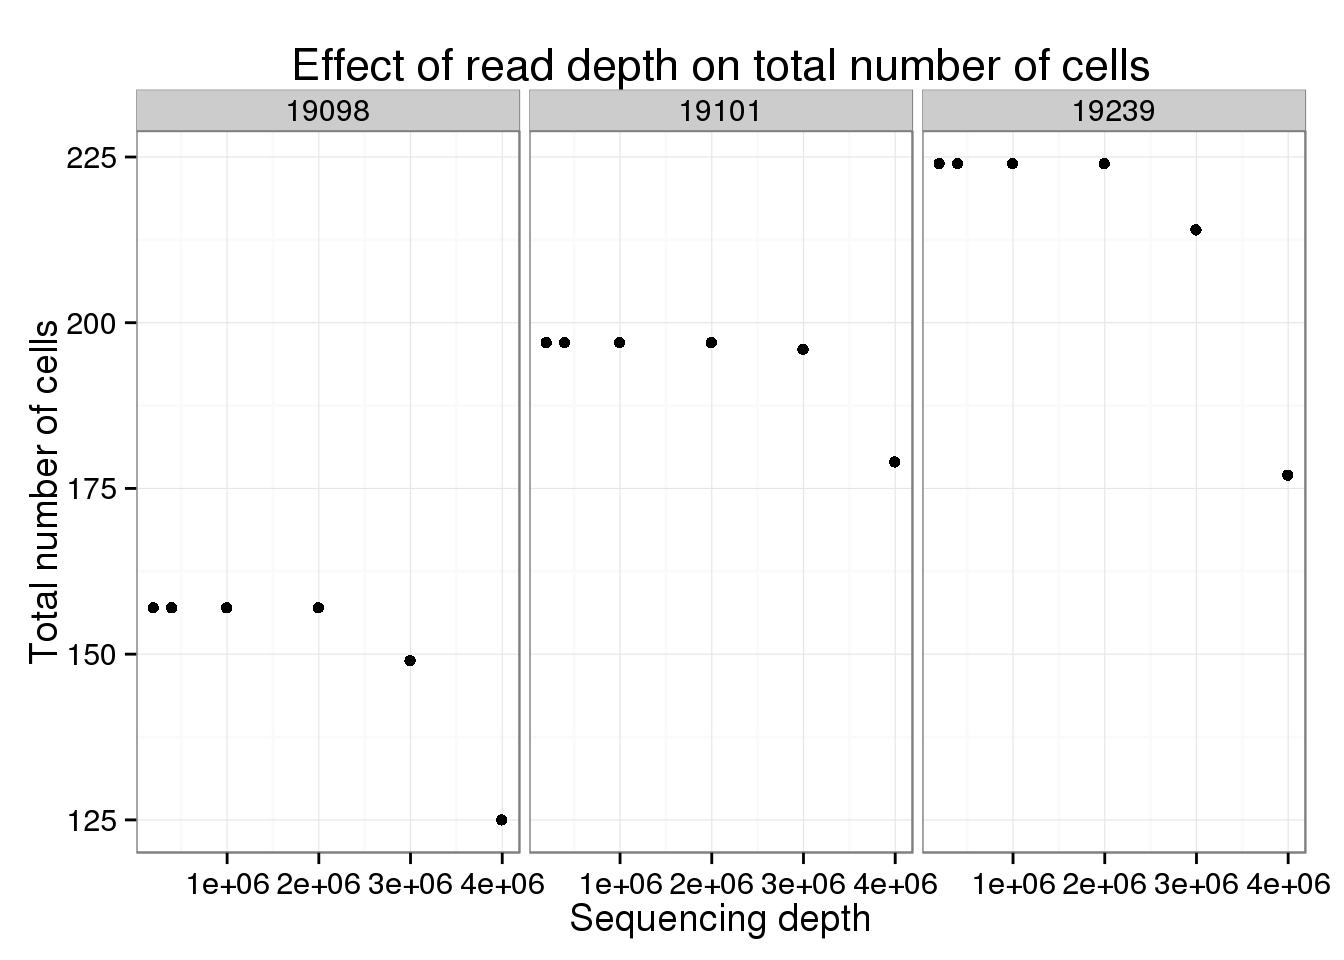
Effect of read depth on total number of genes
Also need to keep in mind that the number of genes included changes due to sequencing depth and number of cells subsampled.
ggplot(var_data_plot, aes(x = depth, y = num_genes)) +
  geom_point() +
  facet_grid(type~ind) +
  labs(x = "Sequencing depth",
       y = "Total number of genes",
       title = "Effect of read depth on total number of genes")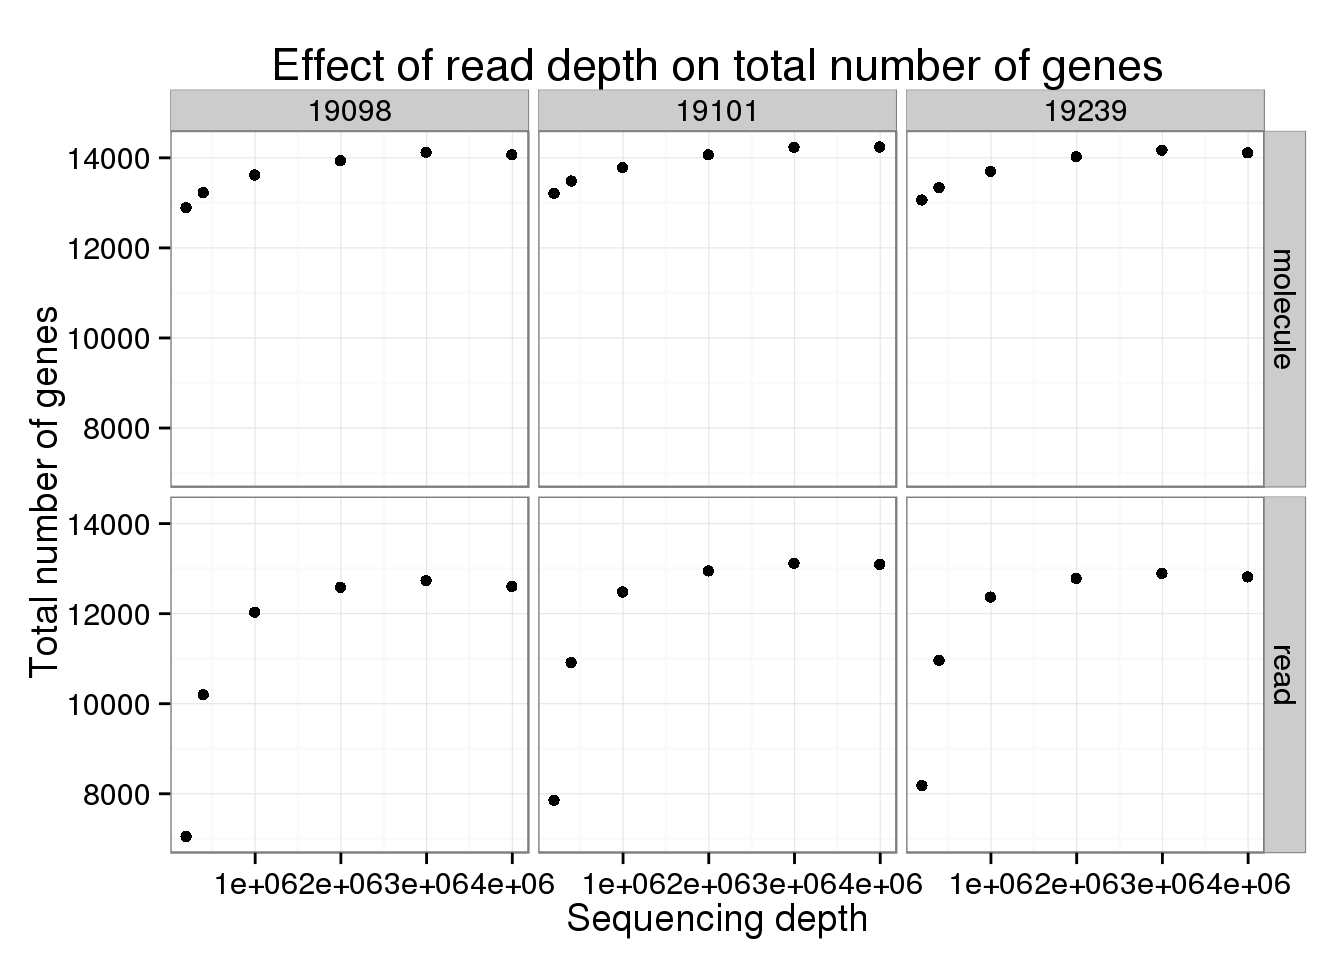
Session information
sessionInfo()R version 3.2.0 (2015-04-16)
Platform: x86_64-unknown-linux-gnu (64-bit)
locale:
[1] LC_CTYPE=en_US.UTF-8 LC_NUMERIC=C
[3] LC_TIME=en_US.UTF-8 LC_COLLATE=en_US.UTF-8
[5] LC_MONETARY=en_US.UTF-8 LC_MESSAGES=en_US.UTF-8
[7] LC_PAPER=en_US.UTF-8 LC_NAME=C
[9] LC_ADDRESS=C LC_TELEPHONE=C
[11] LC_MEASUREMENT=en_US.UTF-8 LC_IDENTIFICATION=C
attached base packages:
[1] stats graphics grDevices utils datasets methods base
other attached packages:
[1] ggplot2_1.0.1 dplyr_0.4.1 knitr_1.10.5
loaded via a namespace (and not attached):
[1] Rcpp_0.11.6 magrittr_1.5 MASS_7.3-40 munsell_0.4.2
[5] colorspace_1.2-6 stringr_1.0.0 plyr_1.8.2 tools_3.2.0
[9] parallel_3.2.0 grid_3.2.0 gtable_0.1.2 DBI_0.3.1
[13] htmltools_0.2.6 yaml_2.1.13 lazyeval_0.1.10 assertthat_0.1
[17] digest_0.6.8 reshape2_1.4.1 formatR_1.2 evaluate_0.7
[21] rmarkdown_0.6.1 labeling_0.3 stringi_0.4-1 scales_0.2.4
[25] proto_0.3-10