Compare CVs between individuals, remove PCs
Joyce Hsiao
2015-10-26
Last updated: 2015-12-11
Code version: a795f9edad85aa99750bd8425fbe4d89346cfd42
Objective
We filted the first PC from the data and computed per gene CVs based on the filtered data. We observed that the adjusted CV profiles differed significantly between the three individuals.
Also, interestingly, pairwise comparisons revealed that the adjusted CV profile of individual 19239 is is significantly different from the other two individuals (19239 vs. 19098: p < 1e-9; 19239 vs. 19101: p < .007; 19098 vs. 19101: p = .0474. Note that individual 19239 is the one outlier in the PCA plots. Coincidently, PC2 separates 19239 from the other two individuals. However, we observed little correlations between PC2 gene loadings and data-wide CV (before/after filter the first PC), suggesting that factors other than coefficient of variation affects PC2.
Set up
library("data.table")
library("dplyr")
library("limma")
library("edgeR")
library("ggplot2")
library("grid")
theme_set(theme_bw(base_size = 12))
source("functions.R")
Prepare data
Input annotation of only QC-filtered single cells. Remove NA19098.r2
anno_qc_filter <- read.table("../data/annotation-filter.txt", header = TRUE,
                             stringsAsFactors = FALSE)
Import endogeneous gene molecule counts that are QC-filtered, CPM-normalized, ERCC-normalized, and also processed to remove unwanted variation from batch effet. ERCC genes are removed from this file.
molecules_ENSG <- read.table("../data/molecules-final.txt", header = TRUE, stringsAsFactors = FALSE)Input moleclule counts before log2 CPM transformation. This file is used to compute percent zero-count cells per sample.
molecules_sparse <- read.table("../data/molecules-filter.txt", header = TRUE, stringsAsFactors = FALSE)

molecules_sparse <- molecules_sparse[grep("ENSG", rownames(molecules_sparse)), ]
stopifnot( all.equal(rownames(molecules_ENSG), rownames(molecules_sparse)) )
SVD/PCA
library(matrixStats)
centered_ENSG <- molecules_ENSG - rowMeans(molecules_ENSG)
svd_all <- svd( centered_ENSG )
head( (svd_all$d^2)/(sum(svd_all$d^2) ) )
[1] 0.137852451 0.018414108 0.009950908 0.005890242 0.003358104 0.003204841# reproduce SVD results with PCA
# pca_results <- prcomp( t(centered_ENSG) )
# head((pca_results$sdev^2)/(sum(pca_results$sdev^2)) )
par(mfrow = c(2,2))
plot(x = rowMeans(molecules_ENSG), y = svd_all$u[ ,1],
xlab = "mean molecule counts", ylab = "first eigen-cell", cex = .4)
plot(x = rowMeans(molecules_ENSG), y = svd_all$u[ ,2],
xlab = "mean molecule counts", ylab = "second eigen-cell", cex = .4)
plot(x = rowMeans(molecules_ENSG), y = svd_all$u[ ,3],
xlab = "mean molecule counts", ylab = "third eigen-cell", cex = .4)
plot(x = rowMeans(molecules_ENSG), y = svd_all$u[ ,4],
xlab = "mean molecule counts", ylab = "third eigen-cell", cex = .4)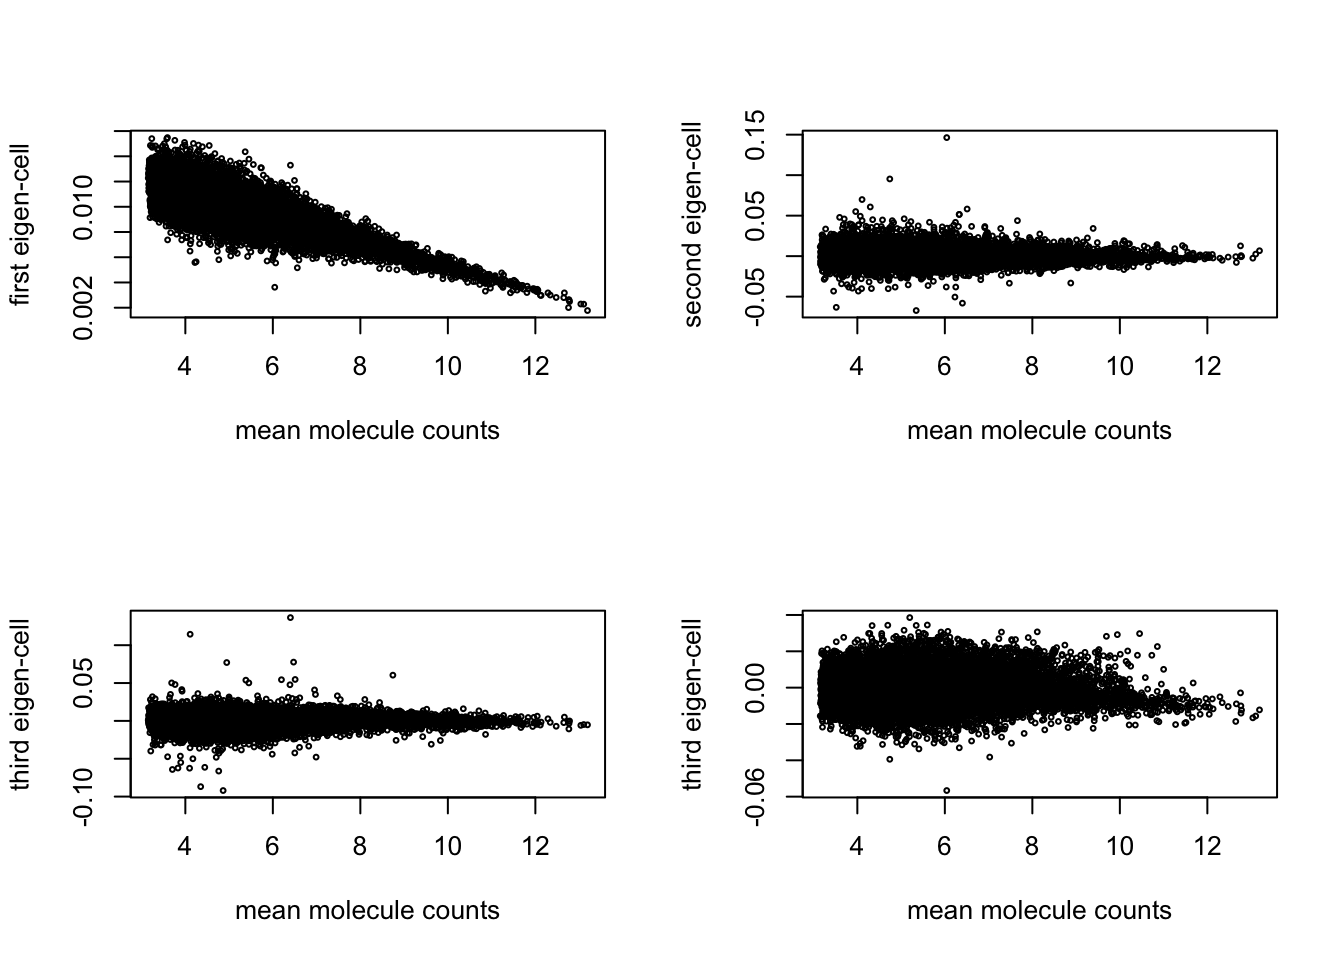
cor(rowMeans(molecules_ENSG), y = svd_all$u[ ,1], method ="spearman")[1] -0.820101- First PC ~ mean gene expression levels/percent genes detected
- Second PC ?
- Third PC ~ differences between the three individuals…
library(gridExtra)
p1 <- ggplot(data.frame(pc1 = svd_all$v[,1],
                        pc2 = svd_all$v[,2],
                        individual = anno_qc_filter$individual),
              aes(x = pc1, y = pc2, col = individual)) +
        geom_point()

p2 <- ggplot(data.frame(pc2 = svd_all$v[,2],
                        pc3 = svd_all$v[,3],
                        individual = anno_qc_filter$individual),
            aes(x = pc3, y = pc2, col = individual) ) +
        geom_point()

grid.arrange(p1, p2, ncol = 2)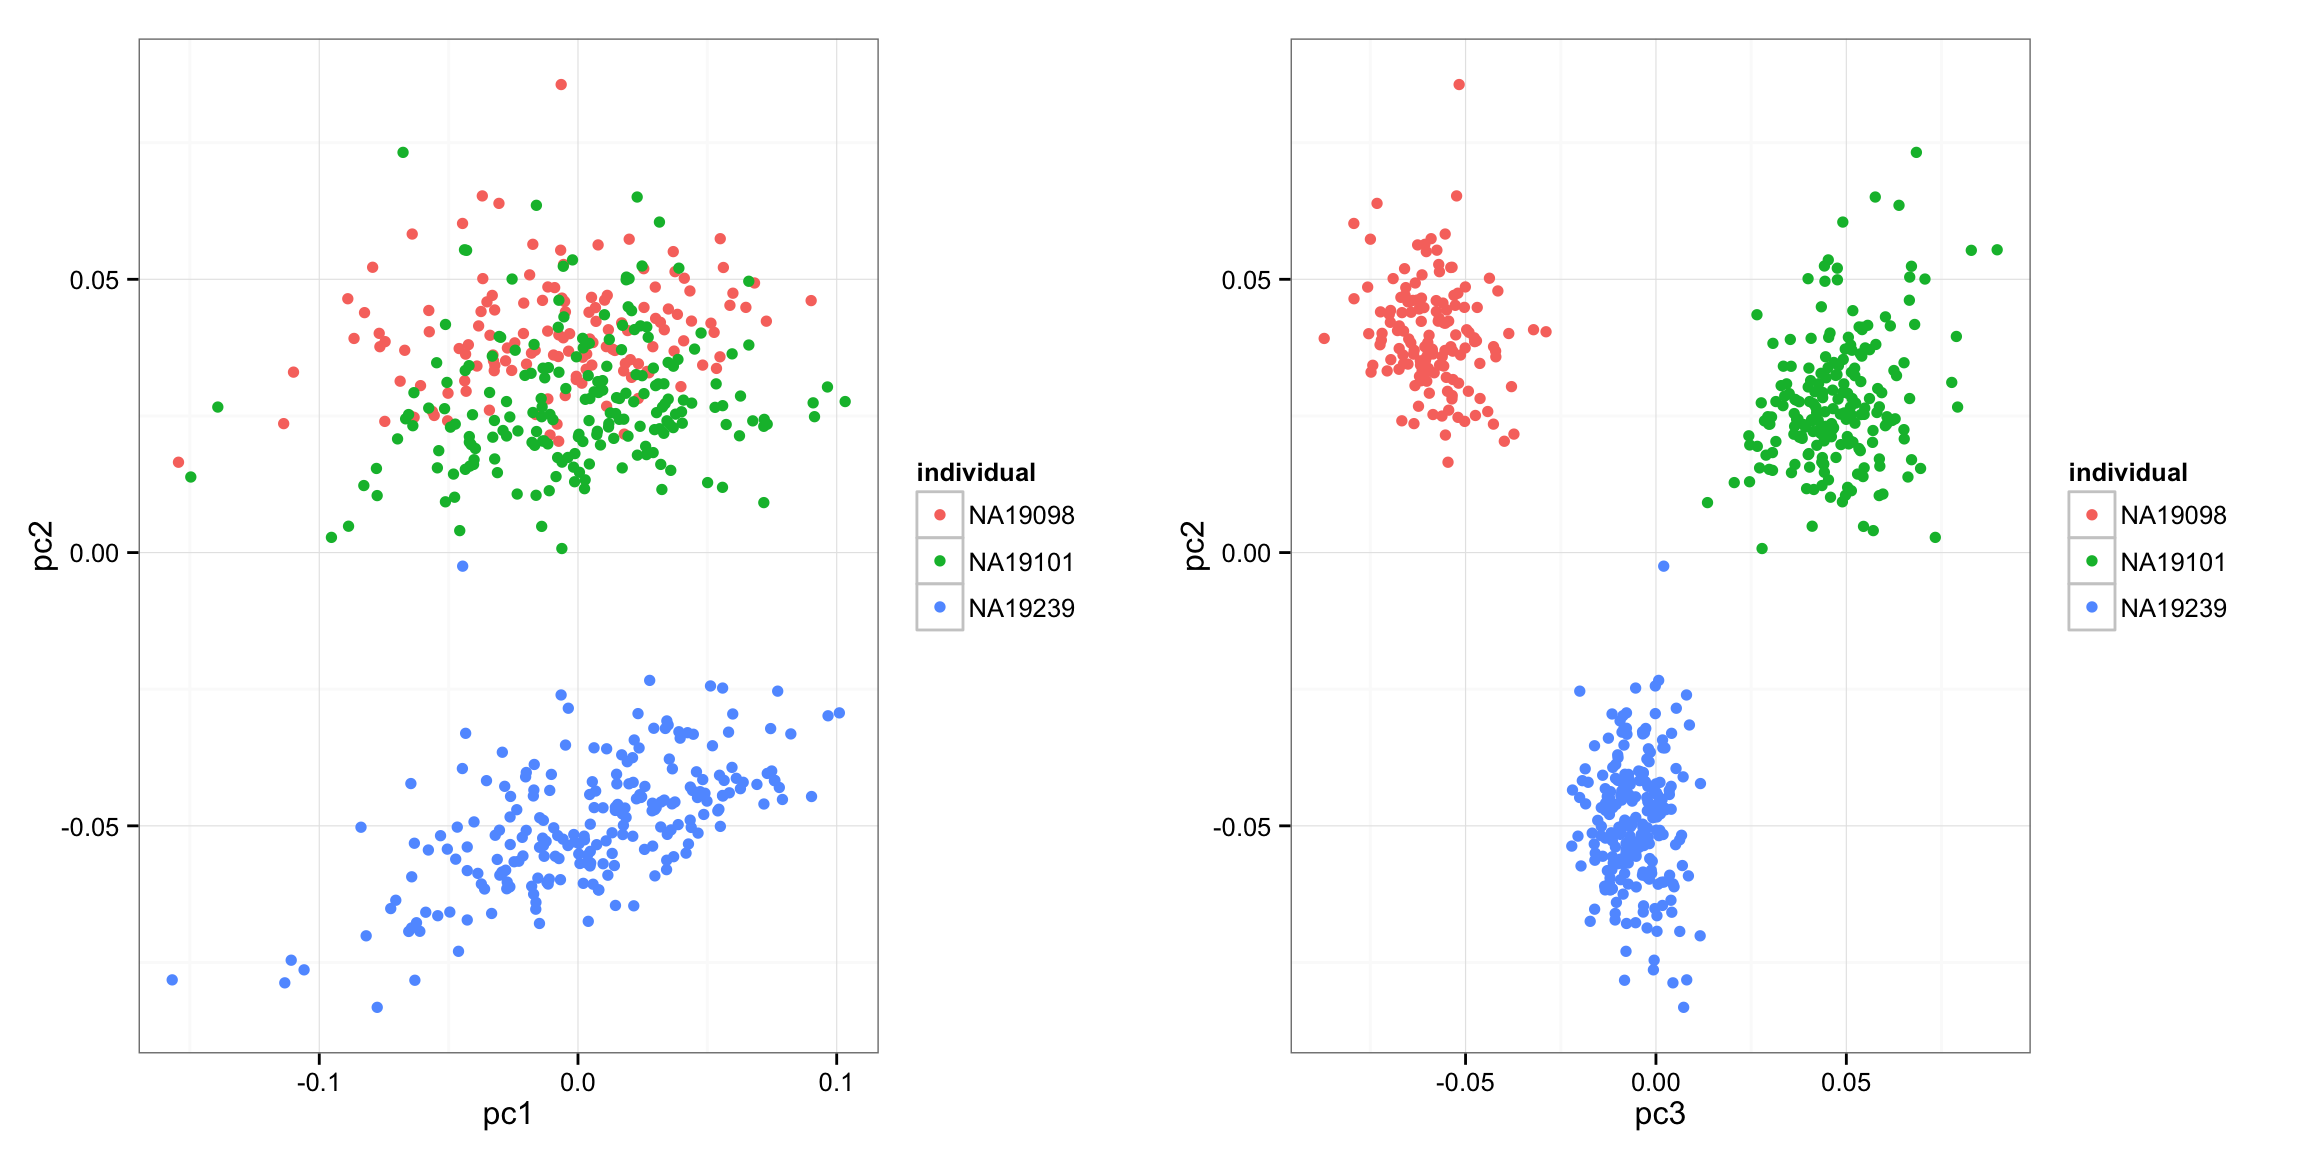
Remove the first PC
filtered_data <- with(svd_all, u %*% diag( c(0, d[-1]) ) %*% t(v))Compute CV of the filtered data
cv_filtered <- lapply(1:3, function(ii_individual) {
    individuals <- unique(anno_qc_filter$individual)
    counts <- filtered_data[ , anno_qc_filter$individual == individuals [ii_individual]]
    means <- apply(counts, 1, mean)
    sds <- apply(counts, 1, sd)
    cv <- sds/means
    return(cv)
})
names(cv_filtered) <- unique(anno_qc_filter$individual)
cv_filtered <- do.call(cbind, cv_filtered)
rownames(cv_filtered) <- rownames(molecules_ENSG)
friedman.test(cv_filtered)
    Friedman rank sum test

data:  cv_filtered
Friedman chi-squared = 14.327, df = 2, p-value = 0.0007744
friedman.test(cv_filtered[ , c(1,2)])
    Friedman rank sum test

data:  cv_filtered[, c(1, 2)]
Friedman chi-squared = 4.2544, df = 1, p-value = 0.03915
friedman.test(cv_filtered[ , c(1,3)])
    Friedman rank sum test

data:  cv_filtered[, c(1, 3)]
Friedman chi-squared = 15.758, df = 1, p-value = 7.2e-05
friedman.test(cv_filtered[ , c(2,3)])
    Friedman rank sum test

data:  cv_filtered[, c(2, 3)]
Friedman chi-squared = 0.045816, df = 1, p-value = 0.8305
Cell-cycle genes
Import cell-cycle genes.
cellcycle_genes <- read.table("../data/cellcyclegenes.txt", sep = "\t",
                              header = TRUE)
dim(cellcycle_genes)
[1] 151 5ii_cellcycle <- rownames(cv_filtered) %in% unlist(cellcycle_genes)
friedman.test(cv_filtered[which(ii_cellcycle), ])
    Friedman rank sum test

data:  cv_filtered[which(ii_cellcycle), ]
Friedman chi-squared = 15.471, df = 2, p-value = 0.0004369
Non-cell-cycle genes
friedman.test(cv_filtered[which(!ii_cellcycle), ] )
    Friedman rank sum test

data:  cv_filtered[which(!ii_cellcycle), ]
Friedman chi-squared = 9.4449, df = 2, p-value = 0.008893
Pluripotent genes
pluripotent_genes <- read.table("../data/pluripotency-genes.txt", sep = "\t",
                                header = TRUE)$To
Friedman test.
ii_pluripotent <- (rownames(cv_filtered) %in% unlist(pluripotent_genes))
pca_all_pluripotent <- cv_filtered[which(ii_pluripotent), ]
friedman.test(pca_all_pluripotent)
    Friedman rank sum test

data:  pca_all_pluripotent
Friedman chi-squared = 9.1429, df = 2, p-value = 0.01034
Find driving genes of PC2
# compute data-wide cv
data_cv <- apply(molecules_ENSG, 1, sd)/apply(molecules_ENSG, 1, mean)
par(mfrow = c(2,2))
plot(x = data_cv, y = svd_all$u[ ,1])
plot(x = data_cv, y = svd_all$u[ ,2])
plot(x = data_cv, y = svd_all$u[ ,3])
plot(x = data_cv, y = svd_all$u[ ,4])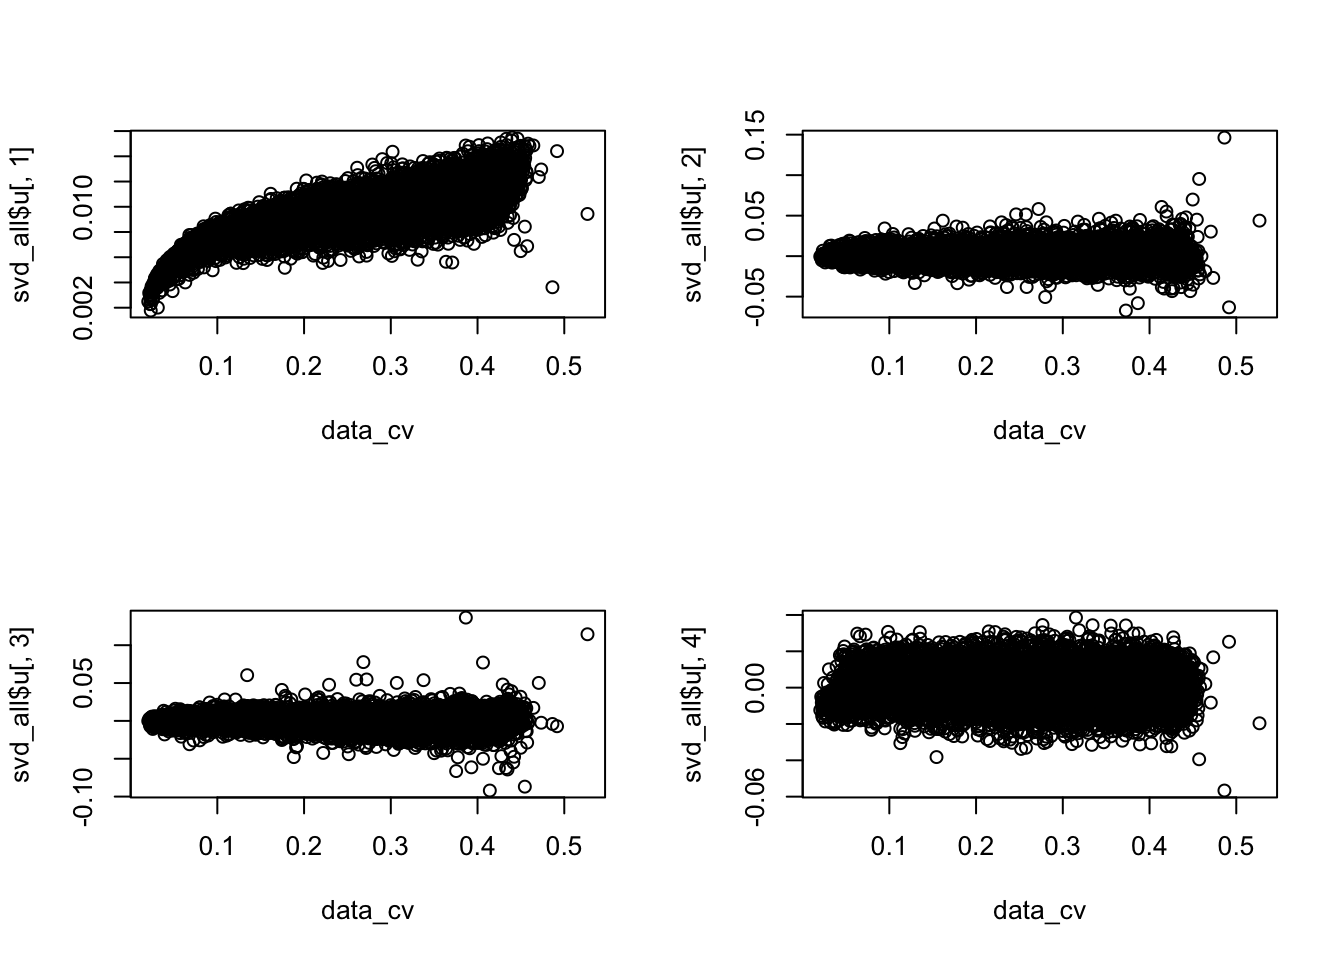
# compute data-wide cv based on the filtered data
filtered_data_cv <- apply(filtered_data, 1, sd)/apply(filtered_data, 1, mean)
par(mfrow = c(2,2))
plot(x = filtered_data_cv, y = svd_all$u[ ,1])
plot(x = filtered_data_cv, y = svd_all$u[ ,2])
plot(x = filtered_data_cv, y = svd_all$u[ ,3])
plot(x = filtered_data_cv, y = svd_all$u[ ,4])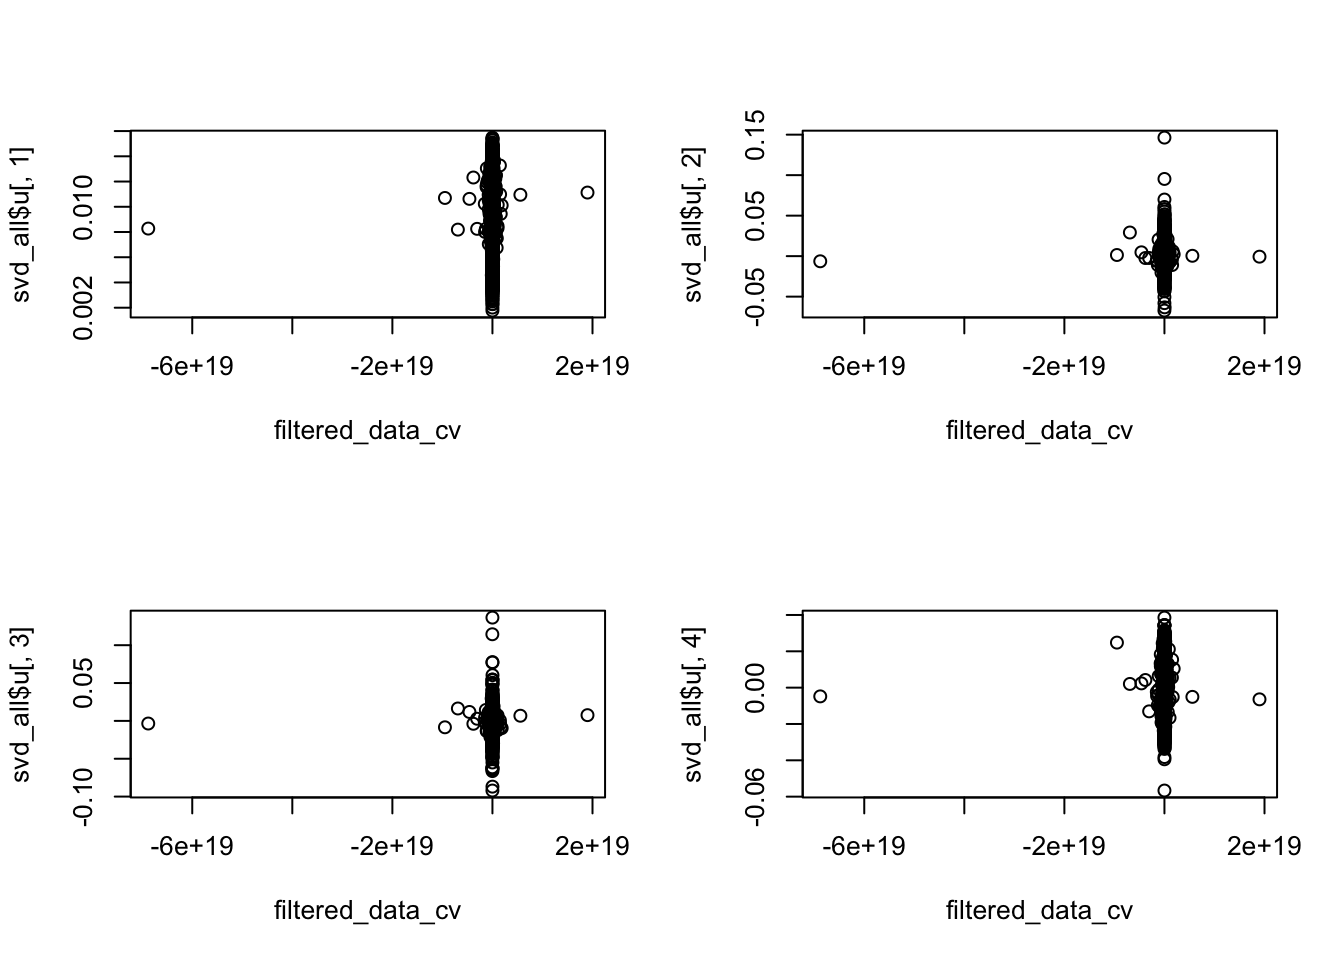
pc2_genes <- svd_all$u[,2]

# find genes outside of 3 mean +/- sd
mean_pc2 <- mean(pc2_genes)
sd_pc2 <- sd(pc2_genes)
ii_extreme <- which( (pc2_genes > mean_pc2 + 3*sd_pc2)|(pc2_genes < mean_pc2 - 3*sd_pc2) )
length(ii_extreme)
[1] 107library(broman)
par(mfrow = c(1,1))
xy <- cbind(c(1:length(pc2_genes)), pc2_genes)
plot(xy, cex = .4, pch = 16,
main = paste("PC2 gene loadings \n",
length(ii_extreme), "genes"), xlab = "genes", ylab = "PC2 loadings")
points(xy[ii_extreme, ], pch = 1, cex = .7, col = brocolors("crayon")["Red Orange"])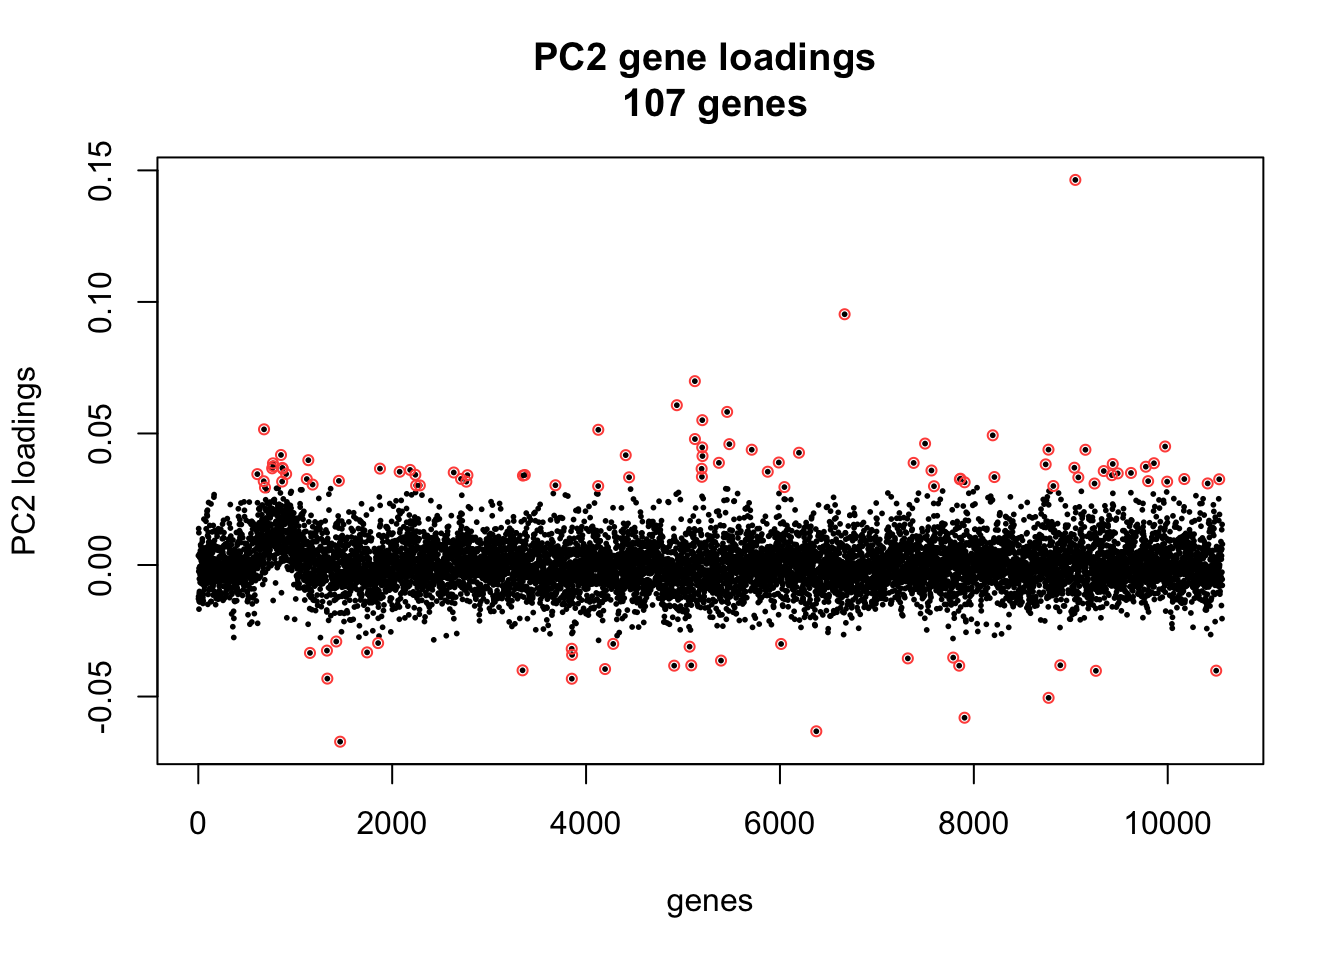
Annotation
library("biomaRt")
ensembl <- useMart(host = "grch37.ensembl.org",
                   biomart = "ENSEMBL_MART_ENSEMBL",
                   dataset = "hsapiens_gene_ensembl")
pc2_gene_info <- getBM(attributes = c("ensembl_gene_id", "chromosome_name",
                                       "external_gene_name", "transcript_count",
                                       "description"),
                        filters = "ensembl_gene_id",
                        values = rownames(molecules_ENSG[ii_extreme, ]),
                        mart = ensembl)
kable(pc2_gene_info[ , c(1, 2, 3, 5)])| ensembl_gene_id | chromosome_name | external_gene_name | description |
|---|---|---|---|
| ENSG00000007080 | 19 | CCDC124 | coiled-coil domain containing 124 [Source:HGNC Symbol;Acc:25171] |
| ENSG00000022556 | 19 | NLRP2 | NLR family, pyrin domain containing 2 [Source:HGNC Symbol;Acc:22948] |
| ENSG00000026025 | 10 | VIM | vimentin [Source:HGNC Symbol;Acc:12692] |
| ENSG00000048392 | 8 | RRM2B | ribonucleotide reductase M2 B (TP53 inducible) [Source:HGNC Symbol;Acc:17296] |
| ENSG00000048540 | 12 | LMO3 | LIM domain only 3 (rhombotin-like 2) [Source:HGNC Symbol;Acc:6643] |
| ENSG00000053438 | 20 | NNAT | neuronatin [Source:HGNC Symbol;Acc:7860] |
| ENSG00000064042 | 4 | LIMCH1 | LIM and calponin homology domains 1 [Source:HGNC Symbol;Acc:29191] |
| ENSG00000066084 | 12 | DIP2B | DIP2 disco-interacting protein 2 homolog B (Drosophila) [Source:HGNC Symbol;Acc:29284] |
| ENSG00000075391 | 1 | RASAL2 | RAS protein activator like 2 [Source:HGNC Symbol;Acc:9874] |
| ENSG00000076924 | 19 | XAB2 | XPA binding protein 2 [Source:HGNC Symbol;Acc:14089] |
| ENSG00000078295 | 5 | ADCY2 | adenylate cyclase 2 (brain) [Source:HGNC Symbol;Acc:233] |
| ENSG00000085552 | 1 | IGSF9 | immunoglobulin superfamily, member 9 [Source:HGNC Symbol;Acc:18132] |
| ENSG00000095739 | 10 | BAMBI | BMP and activin membrane-bound inhibitor [Source:HGNC Symbol;Acc:30251] |
| ENSG00000101850 | X | GPR143 | G protein-coupled receptor 143 [Source:HGNC Symbol;Acc:20145] |
| ENSG00000104722 | 8 | NEFM | neurofilament, medium polypeptide [Source:HGNC Symbol;Acc:7734] |
| ENSG00000105669 | 19 | COPE | coatomer protein complex, subunit epsilon [Source:HGNC Symbol;Acc:2234] |
| ENSG00000106078 | 7 | COBL | cordon-bleu WH2 repeat protein [Source:HGNC Symbol;Acc:22199] |
| ENSG00000106153 | 7 | CHCHD2 | coiled-coil-helix-coiled-coil-helix domain containing 2 [Source:HGNC Symbol;Acc:21645] |
| ENSG00000106236 | 7 | NPTX2 | neuronal pentraxin II [Source:HGNC Symbol;Acc:7953] |
| ENSG00000107105 | 9 | ELAVL2 | ELAV like neuron-specific RNA binding protein 2 [Source:HGNC Symbol;Acc:3313] |
| ENSG00000108821 | 17 | COL1A1 | collagen, type I, alpha 1 [Source:HGNC Symbol;Acc:2197] |
| ENSG00000110092 | 11 | CCND1 | cyclin D1 [Source:HGNC Symbol;Acc:1582] |
| ENSG00000112394 | 6 | SLC16A10 | solute carrier family 16 (aromatic amino acid transporter), member 10 [Source:HGNC Symbol;Acc:17027] |
| ENSG00000115339 | 2 | GALNT3 | UDP-N-acetyl-alpha-D-galactosamine:polypeptide N-acetylgalactosaminyltransferase 3 (GalNAc-T3) [Source:HGNC Symbol;Acc:4125] |
| ENSG00000120889 | 8 | TNFRSF10B | tumor necrosis factor receptor superfamily, member 10b [Source:HGNC Symbol;Acc:11905] |
| ENSG00000121101 | 17 | TEX14 | testis expressed 14 [Source:HGNC Symbol;Acc:11737] |
| ENSG00000123243 | 10 | ITIH5 | inter-alpha-trypsin inhibitor heavy chain family, member 5 [Source:HGNC Symbol;Acc:21449] |
| ENSG00000123560 | X | PLP1 | proteolipid protein 1 [Source:HGNC Symbol;Acc:9086] |
| ENSG00000124839 | 2 | RAB17 | RAB17, member RAS oncogene family [Source:HGNC Symbol;Acc:16523] |
| ENSG00000125148 | 16 | MT2A | metallothionein 2A [Source:HGNC Symbol;Acc:7406] |
| ENSG00000128052 | 4 | KDR | kinase insert domain receptor (a type III receptor tyrosine kinase) [Source:HGNC Symbol;Acc:6307] |
| ENSG00000128610 | 7 | FEZF1 | FEZ family zinc finger 1 [Source:HGNC Symbol;Acc:22788] |
| ENSG00000129244 | 17 | ATP1B2 | ATPase, Na+/K+ transporting, beta 2 polypeptide [Source:HGNC Symbol;Acc:805] |
| ENSG00000129317 | 12 | PUS7L | pseudouridylate synthase 7 homolog (S. cerevisiae)-like [Source:HGNC Symbol;Acc:25276] |
| ENSG00000130529 | 19 | TRPM4 | transient receptor potential cation channel, subfamily M, member 4 [Source:HGNC Symbol;Acc:17993] |
| ENSG00000131848 | 19 | ZSCAN5A | zinc finger and SCAN domain containing 5A [Source:HGNC Symbol;Acc:23710] |
| ENSG00000133104 | 13 | SPG20 | spastic paraplegia 20 (Troyer syndrome) [Source:HGNC Symbol;Acc:18514] |
| ENSG00000134954 | 11 | ETS1 | v-ets avian erythroblastosis virus E26 oncogene homolog 1 [Source:HGNC Symbol;Acc:3488] |
| ENSG00000135272 | 7 | MDFIC | MyoD family inhibitor domain containing [Source:HGNC Symbol;Acc:28870] |
| ENSG00000135549 | 6 | PKIB | protein kinase (cAMP-dependent, catalytic) inhibitor beta [Source:HGNC Symbol;Acc:9018] |
| ENSG00000135862 | 1 | LAMC1 | laminin, gamma 1 (formerly LAMB2) [Source:HGNC Symbol;Acc:6492] |
| ENSG00000136110 | 13 | LECT1 | leukocyte cell derived chemotaxin 1 [Source:HGNC Symbol;Acc:17005] |
| ENSG00000137871 | 15 | ZNF280D | zinc finger protein 280D [Source:HGNC Symbol;Acc:25953] |
| ENSG00000138035 | 2 | PNPT1 | polyribonucleotide nucleotidyltransferase 1 [Source:HGNC Symbol;Acc:23166] |
| ENSG00000139209 | 12 | SLC38A4 | solute carrier family 38, member 4 [Source:HGNC Symbol;Acc:14679] |
| ENSG00000139364 | 12 | TMEM132B | transmembrane protein 132B [Source:HGNC Symbol;Acc:29397] |
| ENSG00000141510 | 17 | TP53 | tumor protein p53 [Source:HGNC Symbol;Acc:11998] |
| ENSG00000143320 | 1 | CRABP2 | cellular retinoic acid binding protein 2 [Source:HGNC Symbol;Acc:2339] |
| ENSG00000143324 | 1 | XPR1 | xenotropic and polytropic retrovirus receptor 1 [Source:HGNC Symbol;Acc:12827] |
| ENSG00000143375 | 1 | CGN | cingulin [Source:HGNC Symbol;Acc:17429] |
| ENSG00000143416 | 1 | SELENBP1 | selenium binding protein 1 [Source:HGNC Symbol;Acc:10719] |
| ENSG00000144057 | 2 | ST6GAL2 | ST6 beta-galactosamide alpha-2,6-sialyltranferase 2 [Source:HGNC Symbol;Acc:10861] |
| ENSG00000145908 | 5 | ZNF300 | zinc finger protein 300 [Source:HGNC Symbol;Acc:13091] |
| ENSG00000148175 | 9 | STOM | stomatin [Source:HGNC Symbol;Acc:3383] |
| ENSG00000148680 | 10 | HTR7 | 5-hydroxytryptamine (serotonin) receptor 7, adenylate cyclase-coupled [Source:HGNC Symbol;Acc:5302] |
| ENSG00000148834 | 10 | GSTO1 | glutathione S-transferase omega 1 [Source:HGNC Symbol;Acc:13312] |
| ENSG00000150510 | 13 | FAM124A | family with sequence similarity 124A [Source:HGNC Symbol;Acc:26413] |
| ENSG00000152256 | 2 | PDK1 | pyruvate dehydrogenase kinase, isozyme 1 [Source:HGNC Symbol;Acc:8809] |
| ENSG00000152778 | 10 | IFIT5 | interferon-induced protein with tetratricopeptide repeats 5 [Source:HGNC Symbol;Acc:13328] |
| ENSG00000152818 | 6 | UTRN | utrophin [Source:HGNC Symbol;Acc:12635] |
| ENSG00000157778 | 7 | PSMG3 | proteasome (prosome, macropain) assembly chaperone 3 [Source:HGNC Symbol;Acc:22420] |
| ENSG00000160321 | 19 | ZNF208 | zinc finger protein 208 [Source:HGNC Symbol;Acc:12999] |
| ENSG00000162783 | 1 | IER5 | immediate early response 5 [Source:HGNC Symbol;Acc:5393] |
| ENSG00000163762 | 3 | TM4SF18 | transmembrane 4 L six family member 18 [Source:HGNC Symbol;Acc:25181] |
| ENSG00000164237 | 5 | CMBL | carboxymethylenebutenolidase homolog (Pseudomonas) [Source:HGNC Symbol;Acc:25090] |
| ENSG00000164265 | 5 | SCGB3A2 | secretoglobin, family 3A, member 2 [Source:HGNC Symbol;Acc:18391] |
| ENSG00000164434 | 6 | FABP7 | fatty acid binding protein 7, brain [Source:HGNC Symbol;Acc:3562] |
| ENSG00000164978 | 9 | NUDT2 | nudix (nucleoside diphosphate linked moiety X)-type motif 2 [Source:HGNC Symbol;Acc:8049] |
| ENSG00000165061 | 8 | ZMAT4 | zinc finger, matrin-type 4 [Source:HGNC Symbol;Acc:25844] |
| ENSG00000165623 | 10 | UCMA | upper zone of growth plate and cartilage matrix associated [Source:HGNC Symbol;Acc:25205] |
| ENSG00000165646 | 10 | SLC18A2 | solute carrier family 18 (vesicular monoamine transporter), member 2 [Source:HGNC Symbol;Acc:10935] |
| ENSG00000166450 | 15 | PRTG | protogenin [Source:HGNC Symbol;Acc:26373] |
| ENSG00000167996 | 11 | FTH1 | ferritin, heavy polypeptide 1 [Source:HGNC Symbol;Acc:3976] |
| ENSG00000168824 | 4 | NSG1 | Homo sapiens neuron specific gene family member 1 (NSG1), transcript variant 3, mRNA. [Source:RefSeq mRNA;Acc:NM_001287763] |
| ENSG00000169136 | 19 | ATF5 | activating transcription factor 5 [Source:HGNC Symbol;Acc:790] |
| ENSG00000169715 | 16 | MT1E | metallothionein 1E [Source:HGNC Symbol;Acc:7397] |
| ENSG00000170561 | 5 | IRX2 | iroquois homeobox 2 [Source:HGNC Symbol;Acc:14359] |
| ENSG00000171466 | 19 | ZNF562 | zinc finger protein 562 [Source:HGNC Symbol;Acc:25950] |
| ENSG00000172663 | 11 | TMEM134 | transmembrane protein 134 [Source:HGNC Symbol;Acc:26142] |
| ENSG00000172667 | 3 | ZMAT3 | zinc finger, matrin-type 3 [Source:HGNC Symbol;Acc:29983] |
| ENSG00000174307 | 1 | PHLDA3 | pleckstrin homology-like domain, family A, member 3 [Source:HGNC Symbol;Acc:8934] |
| ENSG00000176386 | 9 | CDC26 | cell division cycle 26 [Source:HGNC Symbol;Acc:17839] |
| ENSG00000178104 | 1 | PDE4DIP | phosphodiesterase 4D interacting protein [Source:HGNC Symbol;Acc:15580] |
| ENSG00000181666 | 19 | HKR1 | HKR1, GLI-Kruppel zinc finger family member [Source:HGNC Symbol;Acc:4928] |
| ENSG00000182195 | X | LDOC1 | leucine zipper, down-regulated in cancer 1 [Source:HGNC Symbol;Acc:6548] |
| ENSG00000183439 | 4 | TRIM61 | tripartite motif containing 61 [Source:HGNC Symbol;Acc:24339] |
| ENSG00000183853 | 1 | KIRREL | kin of IRRE like (Drosophila) [Source:HGNC Symbol;Acc:15734] |
| ENSG00000184216 | X | IRAK1 | interleukin-1 receptor-associated kinase 1 [Source:HGNC Symbol;Acc:6112] |
| ENSG00000184674 | 22 | GSTT1 | glutathione S-transferase theta 1 [Source:HGNC Symbol;Acc:4641] |
| ENSG00000185088 | 15 | RPS27L | ribosomal protein S27-like [Source:HGNC Symbol;Acc:18476] |
| ENSG00000185869 | 19 | ZNF829 | zinc finger protein 829 [Source:HGNC Symbol;Acc:34032] |
| ENSG00000188227 | 19 | ZNF793 | zinc finger protein 793 [Source:HGNC Symbol;Acc:33115] |
| ENSG00000188643 | 1 | S100A16 | S100 calcium binding protein A16 [Source:HGNC Symbol;Acc:20441] |
| ENSG00000189143 | 7 | CLDN4 | claudin 4 [Source:HGNC Symbol;Acc:2046] |
| ENSG00000196967 | 19 | ZNF585A | zinc finger protein 585A [Source:HGNC Symbol;Acc:26305] |
| ENSG00000197024 | 7 | ZNF398 | zinc finger protein 398 [Source:HGNC Symbol;Acc:18373] |
| ENSG00000197134 | 19 | ZNF257 | zinc finger protein 257 [Source:HGNC Symbol;Acc:13498] |
| ENSG00000198825 | 10 | INPP5F | inositol polyphosphate-5-phosphatase F [Source:HGNC Symbol;Acc:17054] |
| ENSG00000198865 | 5 | CCDC152 | coiled-coil domain containing 152 [Source:HGNC Symbol;Acc:34438] |
| ENSG00000198963 | 9 | RORB | RAR-related orphan receptor B [Source:HGNC Symbol;Acc:10259] |
| ENSG00000204262 | 2 | COL5A2 | collagen, type V, alpha 2 [Source:HGNC Symbol;Acc:2210] |
| ENSG00000205358 | 16 | MT1H | metallothionein 1H [Source:HGNC Symbol;Acc:7400] |
| ENSG00000212719 | 17 | C17orf51 | chromosome 17 open reading frame 51 [Source:HGNC Symbol;Acc:27904] |
| ENSG00000230055 | 17 | CISD3 | CDGSH iron sulfur domain 3 [Source:HGNC Symbol;Acc:27578] |
| ENSG00000237515 | 16 | SHISA9 | shisa family member 9 [Source:HGNC Symbol;Acc:37231] |
| ENSG00000250722 | 5 | SEPP1 | selenoprotein P, plasma, 1 [Source:HGNC Symbol;Acc:10751] |
| ENSG00000267041 | 19 | ZNF850 | zinc finger protein 850 [Source:HGNC Symbol;Acc:27994] |
if (file.exists("rda/svd-filtered/pc2-cv.rda")) {
  load("rda/svd-filtered/pc2-cv.rda")
} else {
  library(Humanzee)
  go_pc2 <- GOtest(my_ensembl_gene_universe = rownames(molecules_ENSG),
                my_ensembl_gene_test = rownames(molecules_ENSG)[ii_extreme],
                pval_cutoff = 1, ontology=c("BP","CC","MF") )
  save(go_pc2, file = "rda/svd-filtered/pc2-cv.rda")
}
Extract terms
if (file.exists("rda/svd-filtered/go-pc2-terms.rda")) {
  load("rda/svd-filtered/go-pc2-terms.rda")
} else {
  # Biological process
  goterms_bp <- summary(go_pc2$GO$BP, pvalue = 1)
  goterms_bp <- data.frame(ID = goterms_bp[[1]],
                           Pvalue = goterms_bp[[2]],
                           Terms = goterms_bp[[7]])
  goterms_bp <- goterms_bp[order(goterms_bp$Pvalue), ]

  # Cellular component
  goterms_cc <- summary(go_pc2$GO$CC, pvalue = 1)
  goterms_cc <- data.frame(ID = goterms_cc[[1]],
                           Pvalue = goterms_cc[[2]],
                           Terms = goterms_cc[[7]])
  goterms_cc <- goterms_cc[order(goterms_cc$Pvalue), ]

  # Molecular function
  goterms_mf <- summary(go_pc2$GO$MF, pvalue = 1)
  goterms_mf <- data.frame(ID = goterms_mf[[1]],
                           Pvalue = goterms_mf[[2]],
                           Terms = goterms_mf[[7]])
  goterms_mf <- goterms_mf[order(goterms_mf$Pvalue), ]

  save(goterms_bp, goterms_cc, goterms_mf,
       file = "rda/svd-filtered/go-pc2-terms.rda")
}
head(goterms_bp, 20) ID Pvalue
1 GO:0010043 4.233878e-05
2 GO:0071294 6.411339e-05
3 GO:1902305 1.795128e-04
4 GO:1990267 2.651255e-04
5 GO:0048669 3.380583e-04
6 GO:1903273 3.380583e-04
7 GO:1903275 3.380583e-04
8 GO:1903276 3.380583e-04
9 GO:1903278 3.380583e-04
10 GO:1903286 3.380583e-04
11 GO:1903288 3.380583e-04
12 GO:0045926 3.525005e-04
13 GO:0050794 3.846393e-04
14 GO:0050789 4.175013e-04
15 GO:0002028 6.899663e-04
16 GO:0006814 1.072938e-03
17 GO:0007379 1.111173e-03
18 GO:2000649 1.376235e-03
19 GO:0035725 1.428822e-03
20 GO:0003008 1.477490e-03
Terms
1 response to zinc ion
2 cellular response to zinc ion
3 regulation of sodium ion transmembrane transport
4 response to transition metal nanoparticle
5 collateral sprouting in absence of injury
6 regulation of sodium ion export
7 positive regulation of sodium ion export
8 regulation of sodium ion export from cell
9 positive regulation of sodium ion export from cell
10 regulation of potassium ion import
11 positive regulation of potassium ion import
12 negative regulation of growth
13 regulation of cellular process
14 regulation of biological process
15 regulation of sodium ion transport
16 sodium ion transport
17 segment specification
18 regulation of sodium ion transmembrane transporter activity
19 sodium ion transmembrane transport
20 system processhead(goterms_cc, 20) ID Pvalue Terms
1 GO:0005886 0.001486595 plasma membrane
2 GO:0005890 0.001518698 sodium:potassium-exchanging ATPase complex
3 GO:0016323 0.002148167 basolateral plasma membrane
4 GO:0071944 0.002224033 cell periphery
5 GO:0044459 0.003264812 plasma membrane part
6 GO:0090533 0.003572430 cation-transporting ATPase complex
7 GO:0031226 0.003674196 intrinsic component of plasma membrane
8 GO:0016324 0.004219984 apical plasma membrane
9 GO:0045177 0.005759799 apical part of cell
10 GO:0098533 0.007536376 ATPase dependent transmembrane transport complex
11 GO:0005887 0.007724379 integral component of plasma membrane
12 GO:0098590 0.008426372 plasma membrane region
13 GO:0032591 0.010249974 dendritic spine membrane
14 GO:0036477 0.017893454 somatodendritic compartment
15 GO:0005584 0.020395947 collagen type I trimer
16 GO:0005967 0.020395947 mitochondrial pyruvate dehydrogenase complex
17 GO:0008043 0.020395947 intracellular ferritin complex
18 GO:0033162 0.020395947 melanosome membrane
19 GO:0045009 0.020395947 chitosome
20 GO:0045025 0.020395947 mitochondrial degradosomehead(goterms_mf, 20) ID Pvalue
1 GO:0004551 0.0006593199
2 GO:0005391 0.0016255779
3 GO:0008556 0.0016255779
4 GO:0001671 0.0068617248
5 GO:0035035 0.0080535610
6 GO:0004081 0.0106095053
7 GO:0004654 0.0106095053
8 GO:0005275 0.0106095053
9 GO:0008504 0.0106095053
10 GO:0008796 0.0106095053
11 GO:0008803 0.0106095053
12 GO:0015222 0.0106095053
13 GO:0035240 0.0106095053
14 GO:0035643 0.0106095053
15 GO:0072544 0.0106095053
16 GO:0060590 0.0136606917
17 GO:0015662 0.0152630549
18 GO:0031072 0.0194406746
19 GO:0003835 0.0211075854
20 GO:0004704 0.0211075854
Terms
1 nucleotide diphosphatase activity
2 sodium:potassium-exchanging ATPase activity
3 potassium-transporting ATPase activity
4 ATPase activator activity
5 histone acetyltransferase binding
6 bis(5'-nucleosyl)-tetraphosphatase (asymmetrical) activity
7 polyribonucleotide nucleotidyltransferase activity
8 amine transmembrane transporter activity
9 monoamine transmembrane transporter activity
10 bis(5'-nucleosyl)-tetraphosphatase activity
11 bis(5'-nucleosyl)-tetraphosphatase (symmetrical) activity
12 serotonin transmembrane transporter activity
13 dopamine binding
14 L-DOPA receptor activity
15 L-DOPA binding
16 ATPase regulator activity
17 ATPase activity, coupled to transmembrane movement of ions, phosphorylative mechanism
18 heat shock protein binding
19 beta-galactoside alpha-2,6-sialyltransferase activity
20 NF-kappaB-inducing kinase activityFind driving genes of PC3
pc3_genes <- svd_all$u[ ,3]

# find genes outside of 3 mean +/- sd
mean_pc3 <- mean(pc3_genes)
sd_pc3 <- sd(pc3_genes)
ii_extreme <- which( (pc3_genes > mean_pc2 + 3*sd_pc2)|(pc3_genes < mean_pc2 - 3*sd_pc2) )
length(ii_extreme)
[1] 90library(broman)
par(mfrow = c(1,1))
xy <- cbind(c(1:length(pc3_genes)), pc3_genes)
plot(xy, cex = .4, pch = 16,
main = paste("PC3 gene loadings \n",
length(ii_extreme), "genes"), xlab = "genes", ylab = "PC3 loadings")
points(xy[ii_extreme, ], pch = 1, cex = .7, col = brocolors("crayon")["Shamrock"])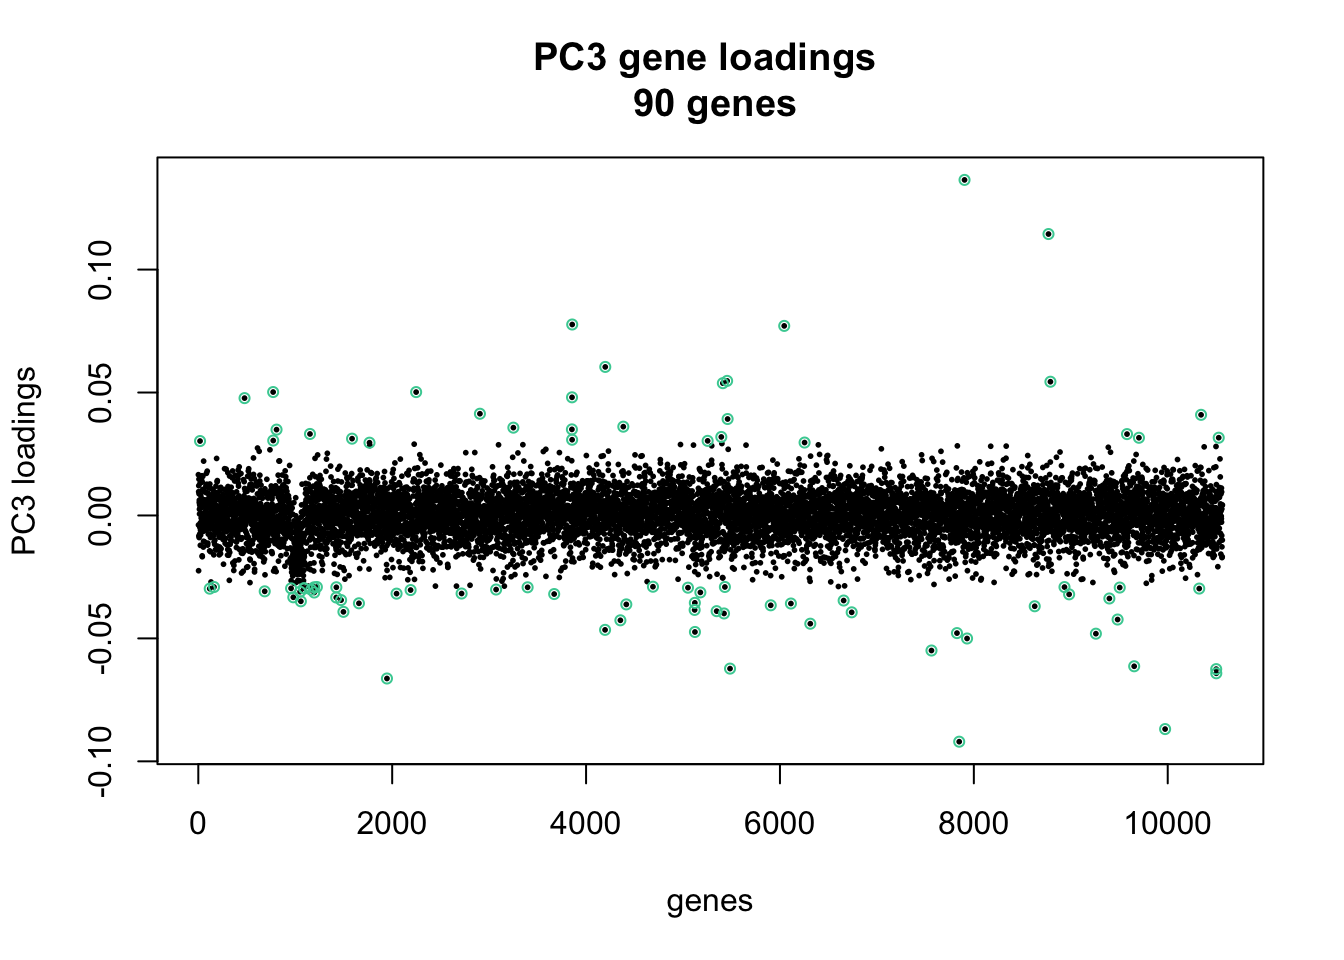
Annotation
library("biomaRt")
ensembl <- useMart(host = "grch37.ensembl.org",
                   biomart = "ENSEMBL_MART_ENSEMBL",
                   dataset = "hsapiens_gene_ensembl")
pc3_gene_info <- getBM(attributes = c("ensembl_gene_id", "chromosome_name",
                                       "external_gene_name", "transcript_count",
                                       "description"),
                        filters = "ensembl_gene_id",
                        values = rownames(molecules_ENSG[ii_extreme, ]),
                        mart = ensembl)
kable(pc3_gene_info[ , c(1, 2, 3, 5)])| ensembl_gene_id | chromosome_name | external_gene_name | description |
|---|---|---|---|
| ENSG00000001461 | 1 | NIPAL3 | NIPA-like domain containing 3 [Source:HGNC Symbol;Acc:25233] |
| ENSG00000003436 | 2 | TFPI | tissue factor pathway inhibitor (lipoprotein-associated coagulation inhibitor) [Source:HGNC Symbol;Acc:11760] |
| ENSG00000004700 | 12 | RECQL | RecQ protein-like (DNA helicase Q1-like) [Source:HGNC Symbol;Acc:9948] |
| ENSG00000022556 | 19 | NLRP2 | NLR family, pyrin domain containing 2 [Source:HGNC Symbol;Acc:22948] |
| ENSG00000026025 | 10 | VIM | vimentin [Source:HGNC Symbol;Acc:12692] |
| ENSG00000053501 | 19 | USE1 | unconventional SNARE in the ER 1 homolog (S. cerevisiae) [Source:HGNC Symbol;Acc:30882] |
| ENSG00000064042 | 4 | LIMCH1 | LIM and calponin homology domains 1 [Source:HGNC Symbol;Acc:29191] |
| ENSG00000065621 | 10 | GSTO2 | glutathione S-transferase omega 2 [Source:HGNC Symbol;Acc:23064] |
| ENSG00000067840 | X | PDZD4 | PDZ domain containing 4 [Source:HGNC Symbol;Acc:21167] |
| ENSG00000075407 | 10 | ZNF37A | zinc finger protein 37A [Source:HGNC Symbol;Acc:13102] |
| ENSG00000078018 | 2 | MAP2 | microtubule-associated protein 2 [Source:HGNC Symbol;Acc:6839] |
| ENSG00000091947 | 17 | TMEM101 | transmembrane protein 101 [Source:HGNC Symbol;Acc:28653] |
| ENSG00000100097 | 22 | LGALS1 | lectin, galactoside-binding, soluble, 1 [Source:HGNC Symbol;Acc:6561] |
| ENSG00000100767 | 14 | PAPLN | papilin, proteoglycan-like sulfated glycoprotein [Source:HGNC Symbol;Acc:19262] |
| ENSG00000100918 | 14 | REC8 | REC8 meiotic recombination protein [Source:HGNC Symbol;Acc:16879] |
| ENSG00000101224 | 20 | CDC25B | cell division cycle 25B [Source:HGNC Symbol;Acc:1726] |
| ENSG00000102309 | X | PIN4 | protein (peptidylprolyl cis/trans isomerase) NIMA-interacting, 4 (parvulin) [Source:HGNC Symbol;Acc:8992] |
| ENSG00000104723 | 8 | TUSC3 | tumor suppressor candidate 3 [Source:HGNC Symbol;Acc:30242] |
| ENSG00000105357 | 19 | MYH14 | myosin, heavy chain 14, non-muscle [Source:HGNC Symbol;Acc:23212] |
| ENSG00000105499 | 19 | PLA2G4C | phospholipase A2, group IVC (cytosolic, calcium-independent) [Source:HGNC Symbol;Acc:9037] |
| ENSG00000106341 | 7 | PPP1R17 | protein phosphatase 1, regulatory subunit 17 [Source:HGNC Symbol;Acc:16973] |
| ENSG00000106460 | 7 | TMEM106B | transmembrane protein 106B [Source:HGNC Symbol;Acc:22407] |
| ENSG00000118523 | 6 | CTGF | connective tissue growth factor [Source:HGNC Symbol;Acc:2500] |
| ENSG00000125144 | 16 | MT1G | metallothionein 1G [Source:HGNC Symbol;Acc:7399] |
| ENSG00000128610 | 7 | FEZF1 | FEZ family zinc finger 1 [Source:HGNC Symbol;Acc:22788] |
| ENSG00000129991 | 19 | TNNI3 | troponin I type 3 (cardiac) [Source:HGNC Symbol;Acc:11947] |
| ENSG00000131203 | 8 | IDO1 | indoleamine 2,3-dioxygenase 1 [Source:HGNC Symbol;Acc:6059] |
| ENSG00000133107 | 13 | TRPC4 | transient receptor potential cation channel, subfamily C, member 4 [Source:HGNC Symbol;Acc:12336] |
| ENSG00000134504 | 18 | KCTD1 | potassium channel tetramerization domain containing 1 [Source:HGNC Symbol;Acc:18249] |
| ENSG00000135549 | 6 | PKIB | protein kinase (cAMP-dependent, catalytic) inhibitor beta [Source:HGNC Symbol;Acc:9018] |
| ENSG00000135747 | 1 | ZNF670 | zinc finger protein 670 [Source:HGNC Symbol;Acc:28167] |
| ENSG00000135749 | 1 | PCNXL2 | pecanex-like 2 (Drosophila) [Source:HGNC Symbol;Acc:8736] |
| ENSG00000136444 | 17 | RSAD1 | radical S-adenosyl methionine domain containing 1 [Source:HGNC Symbol;Acc:25634] |
| ENSG00000137709 | 11 | POU2F3 | POU class 2 homeobox 3 [Source:HGNC Symbol;Acc:19864] |
| ENSG00000137801 | 15 | THBS1 | thrombospondin 1 [Source:HGNC Symbol;Acc:11785] |
| ENSG00000138161 | 10 | CUZD1 | CUB and zona pellucida-like domains 1 [Source:HGNC Symbol;Acc:17937] |
| ENSG00000139209 | 12 | SLC38A4 | solute carrier family 38, member 4 [Source:HGNC Symbol;Acc:14679] |
| ENSG00000142871 | 1 | CYR61 | cysteine-rich, angiogenic inducer, 61 [Source:HGNC Symbol;Acc:2654] |
| ENSG00000143248 | 1 | RGS5 | regulator of G-protein signaling 5 [Source:HGNC Symbol;Acc:10001] |
| ENSG00000143353 | 1 | LYPLAL1 | lysophospholipase-like 1 [Source:HGNC Symbol;Acc:20440] |
| ENSG00000143469 | 1 | SYT14 | synaptotagmin XIV [Source:HGNC Symbol;Acc:23143] |
| ENSG00000148450 | 10 | MSRB2 | methionine sulfoxide reductase B2 [Source:HGNC Symbol;Acc:17061] |
| ENSG00000148834 | 10 | GSTO1 | glutathione S-transferase omega 1 [Source:HGNC Symbol;Acc:13312] |
| ENSG00000148926 | 11 | ADM | adrenomedullin [Source:HGNC Symbol;Acc:259] |
| ENSG00000149531 | 20 | FRG1B | FSHD region gene 1 family, member B [Source:HGNC Symbol;Acc:15792] |
| ENSG00000152904 | 1 | GGPS1 | geranylgeranyl diphosphate synthase 1 [Source:HGNC Symbol;Acc:4249] |
| ENSG00000154556 | 4 | SORBS2 | sorbin and SH3 domain containing 2 [Source:HGNC Symbol;Acc:24098] |
| ENSG00000155542 | 5 | SETD9 | SET domain containing 9 [Source:HGNC Symbol;Acc:28508] |
| ENSG00000158710 | 1 | TAGLN2 | transgelin 2 [Source:HGNC Symbol;Acc:11554] |
| ENSG00000158716 | 1 | DUSP23 | dual specificity phosphatase 23 [Source:HGNC Symbol;Acc:21480] |
| ENSG00000160072 | 1 | ATAD3B | ATPase family, AAA domain containing 3B [Source:HGNC Symbol;Acc:24007] |
| ENSG00000160321 | 19 | ZNF208 | zinc finger protein 208 [Source:HGNC Symbol;Acc:12999] |
| ENSG00000161277 | 19 | THAP8 | THAP domain containing 8 [Source:HGNC Symbol;Acc:23191] |
| ENSG00000163191 | 1 | S100A11 | S100 calcium binding protein A11 [Source:HGNC Symbol;Acc:10488] |
| ENSG00000165323 | 11 | FAT3 | FAT atypical cadherin 3 [Source:HGNC Symbol;Acc:23112] |
| ENSG00000166352 | 11 | C11orf74 | chromosome 11 open reading frame 74 [Source:HGNC Symbol;Acc:25142] |
| ENSG00000166938 | 15 | DIS3L | DIS3 mitotic control homolog (S. cerevisiae)-like [Source:HGNC Symbol;Acc:28698] |
| ENSG00000167555 | 19 | ZNF528 | zinc finger protein 528 [Source:HGNC Symbol;Acc:29384] |
| ENSG00000167601 | 19 | AXL | AXL receptor tyrosine kinase [Source:HGNC Symbol;Acc:905] |
| ENSG00000168300 | 8 | PCMTD1 | protein-L-isoaspartate (D-aspartate) O-methyltransferase domain containing 1 [Source:HGNC Symbol;Acc:30483] |
| ENSG00000169083 | X | AR | androgen receptor [Source:HGNC Symbol;Acc:644] |
| ENSG00000170561 | 5 | IRX2 | iroquois homeobox 2 [Source:HGNC Symbol;Acc:14359] |
| ENSG00000170899 | 6 | GSTA4 | glutathione S-transferase alpha 4 [Source:HGNC Symbol;Acc:4629] |
| ENSG00000170961 | 8 | HAS2 | hyaluronan synthase 2 [Source:HGNC Symbol;Acc:4819] |
| ENSG00000176171 | 10 | BNIP3 | BCL2/adenovirus E1B 19kDa interacting protein 3 [Source:HGNC Symbol;Acc:1084] |
| ENSG00000176386 | 9 | CDC26 | cell division cycle 26 [Source:HGNC Symbol;Acc:17839] |
| ENSG00000176485 | 11 | PLA2G16 | phospholipase A2, group XVI [Source:HGNC Symbol;Acc:17825] |
| ENSG00000179023 | 1 | KLHDC7A | kelch domain containing 7A [Source:HGNC Symbol;Acc:26791] |
| ENSG00000179542 | X | SLITRK4 | SLIT and NTRK-like family, member 4 [Source:HGNC Symbol;Acc:23502] |
| ENSG00000180694 | 8 | TMEM64 | transmembrane protein 64 [Source:HGNC Symbol;Acc:25441] |
| ENSG00000182195 | X | LDOC1 | leucine zipper, down-regulated in cancer 1 [Source:HGNC Symbol;Acc:6548] |
| ENSG00000182986 | 19 | ZNF320 | zinc finger protein 320 [Source:HGNC Symbol;Acc:13842] |
| ENSG00000185829 | 17 | ARL17A | ADP-ribosylation factor-like 17A [Source:HGNC Symbol;Acc:24096] |
| ENSG00000186132 | 2 | C2orf76 | chromosome 2 open reading frame 76 [Source:HGNC Symbol;Acc:27017] |
| ENSG00000186230 | 19 | ZNF749 | zinc finger protein 749 [Source:HGNC Symbol;Acc:32783] |
| ENSG00000187193 | 16 | MT1X | metallothionein 1X [Source:HGNC Symbol;Acc:7405] |
| ENSG00000196418 | 1 | ZNF124 | zinc finger protein 124 [Source:HGNC Symbol;Acc:12907] |
| ENSG00000196693 | 10 | ZNF33B | zinc finger protein 33B [Source:HGNC Symbol;Acc:13097] |
| ENSG00000197020 | 19 | ZNF100 | zinc finger protein 100 [Source:HGNC Symbol;Acc:12880] |
| ENSG00000197134 | 19 | ZNF257 | zinc finger protein 257 [Source:HGNC Symbol;Acc:13498] |
| ENSG00000198093 | 19 | ZNF649 | zinc finger protein 649 [Source:HGNC Symbol;Acc:25741] |
| ENSG00000198417 | 16 | MT1F | metallothionein 1F [Source:HGNC Symbol;Acc:7398] |
| ENSG00000198477 | 22 | ZNF280B | zinc finger protein 280B [Source:HGNC Symbol;Acc:23022] |
| ENSG00000198865 | 5 | CCDC152 | coiled-coil domain containing 152 [Source:HGNC Symbol;Acc:34438] |
| ENSG00000204147 | 10 | ASAH2B | N-acylsphingosine amidohydrolase (non-lysosomal ceramidase) 2B [Source:HGNC Symbol;Acc:23456] |
| ENSG00000205358 | 16 | MT1H | metallothionein 1H [Source:HGNC Symbol;Acc:7400] |
| ENSG00000212719 | 17 | C17orf51 | chromosome 17 open reading frame 51 [Source:HGNC Symbol;Acc:27904] |
| ENSG00000227184 | 8 | EPPK1 | epiplakin 1 [Source:HGNC Symbol;Acc:15577] |
| ENSG00000256618 | 17 | MTRNR2L1 | MT-RNR2-like 1 [Source:HGNC Symbol;Acc:37155] |
| ENSG00000260362 | 16 | RP11-297M9.1 | Uncharacterized protein [Source:UniProtKB/TrEMBL;Acc:H3BT68] |
if (file.exists("rda/svd-filtered/pc3-cv.rda")) {
  load("rda/svd-filtered/pc3-cv.rda")
} else {
  library(Humanzee)
  go_pc3 <- GOtest(my_ensembl_gene_universe = rownames(molecules_ENSG),
                my_ensembl_gene_test = rownames(molecules_ENSG)[ii_extreme],
                pval_cutoff = 1, ontology=c("BP","CC","MF") )
  save(go_pc3, file = "rda/svd-filtered/pc2-cv.rda")
}
Extract terms
if (file.exists("rda/svd-filtered/go-pc3-terms.rda")) {
  load("rda/svd-filtered/go-pc3-terms.rda")
} else {
  # Biological process
  goterms_bp <- summary(go_pc3$GO$BP, pvalue = 1)
  goterms_bp <- data.frame(ID = goterms_bp[[1]],
                           Pvalue = goterms_bp[[2]],
                           Terms = goterms_bp[[7]])
  goterms_bp <- goterms_bp[order(goterms_bp$Pvalue), ]

  # Cellular component
  goterms_cc <- summary(go_pc3$GO$CC, pvalue = 1)
  goterms_cc <- data.frame(ID = goterms_cc[[1]],
                           Pvalue = goterms_cc[[2]],
                           Terms = goterms_cc[[7]])
  goterms_cc <- goterms_cc[order(goterms_cc$Pvalue), ]

  # Molecular function
  goterms_mf <- summary(go_pc3$GO$MF, pvalue = 1)
  goterms_mf <- data.frame(ID = goterms_mf[[1]],
                           Pvalue = goterms_mf[[2]],
                           Terms = goterms_mf[[7]])
  goterms_mf <- goterms_mf[order(goterms_mf$Pvalue), ]

  save(goterms_bp, goterms_cc, goterms_mf,
       file = "rda/svd-filtered/go-pc3-terms.rda")
}
head(goterms_bp, 20) ID Pvalue
1 GO:0071294 3.878761e-07
2 GO:0071276 1.148025e-06
3 GO:0071241 1.117054e-05
4 GO:0010043 1.994167e-05
5 GO:0071248 7.431671e-05
6 GO:0046686 9.915044e-05
7 GO:1901685 4.151958e-04
8 GO:1901687 4.151958e-04
9 GO:0031589 4.247346e-04
10 GO:0036149 7.602917e-04
11 GO:0006936 9.161115e-04
12 GO:0002544 1.133887e-03
13 GO:0045989 1.133887e-03
14 GO:1990267 1.286417e-03
15 GO:0006941 1.474185e-03
16 GO:0007263 1.578329e-03
17 GO:0010038 1.624272e-03
18 GO:0072507 2.141512e-03
19 GO:0048469 2.281605e-03
20 GO:0033555 2.281980e-03
Terms
1 cellular response to zinc ion
2 cellular response to cadmium ion
3 cellular response to inorganic substance
4 response to zinc ion
5 cellular response to metal ion
6 response to cadmium ion
7 glutathione derivative metabolic process
8 glutathione derivative biosynthetic process
9 cell-substrate adhesion
10 phosphatidylinositol acyl-chain remodeling
11 muscle contraction
12 chronic inflammatory response
13 positive regulation of striated muscle contraction
14 response to transition metal nanoparticle
15 striated muscle contraction
16 nitric oxide mediated signal transduction
17 response to metal ion
18 divalent inorganic cation homeostasis
19 cell maturation
20 multicellular organismal response to stresshead(goterms_cc, 20) ID Pvalue Terms
1 GO:0005589 0.008785692 collagen type VI trimer
2 GO:0030485 0.008785692 smooth muscle contractile fiber
3 GO:0044228 0.008785692 host cell surface
4 GO:0098647 0.008785692 collagen beaded filament
5 GO:0031012 0.010730464 extracellular matrix
6 GO:0005577 0.017495106 fibrinogen complex
7 GO:0097443 0.017495106 sorting endosome
8 GO:0005578 0.021674083 proteinaceous extracellular matrix
9 GO:0048471 0.022341863 perinuclear region of cytoplasm
10 GO:0000798 0.026128898 nuclear cohesin complex
11 GO:0034991 0.026128898 nuclear meiotic cohesin complex
12 GO:0097513 0.026128898 myosin II filament
13 GO:0005882 0.031905152 intermediate filament
14 GO:0018995 0.034687715 host
15 GO:0030893 0.034687715 meiotic cohesin complex
16 GO:0032982 0.034687715 myosin filament
17 GO:0033643 0.034687715 host cell part
18 GO:0043245 0.034687715 extraorganismal space
19 GO:0043657 0.034687715 host cell
20 GO:0044215 0.034687715 other organismhead(goterms_mf, 20) ID Pvalue
1 GO:0016672 7.222821e-05
2 GO:0045174 7.222821e-05
3 GO:0050610 7.222821e-05
4 GO:0004364 1.619106e-04
5 GO:0019838 1.920784e-04
6 GO:0030613 2.154802e-04
7 GO:0030614 2.154802e-04
8 GO:0016765 4.334233e-04
9 GO:0015038 7.103117e-04
10 GO:0001948 7.841233e-04
11 GO:0015037 1.059556e-03
12 GO:0050840 1.358660e-03
13 GO:0005178 1.680954e-03
14 GO:0050839 1.913923e-03
15 GO:0001786 2.500895e-03
16 GO:0004620 2.731199e-03
17 GO:0016667 3.509092e-03
18 GO:0004623 3.778650e-03
19 GO:0005520 4.509316e-03
20 GO:0001968 5.299753e-03
Terms
1 oxidoreductase activity, acting on a sulfur group of donors, quinone or similar compound as acceptor
2 glutathione dehydrogenase (ascorbate) activity
3 methylarsonate reductase activity
4 glutathione transferase activity
5 growth factor binding
6 oxidoreductase activity, acting on phosphorus or arsenic in donors
7 oxidoreductase activity, acting on phosphorus or arsenic in donors, disulfide as acceptor
8 transferase activity, transferring alkyl or aryl (other than methyl) groups
9 glutathione disulfide oxidoreductase activity
10 glycoprotein binding
11 peptide disulfide oxidoreductase activity
12 extracellular matrix binding
13 integrin binding
14 cell adhesion molecule binding
15 phosphatidylserine binding
16 phospholipase activity
17 oxidoreductase activity, acting on a sulfur group of donors
18 phospholipase A2 activity
19 insulin-like growth factor binding
20 fibronectin bindingSession information
sessionInfo()R version 3.2.1 (2015-06-18)
Platform: x86_64-apple-darwin13.4.0 (64-bit)
Running under: OS X 10.10.5 (Yosemite)
locale:
[1] en_US.UTF-8/en_US.UTF-8/en_US.UTF-8/C/en_US.UTF-8/en_US.UTF-8
attached base packages:
[1] parallel stats4 grid stats graphics grDevices utils
[8] datasets methods base
other attached packages:
[1] org.Hs.eg.db_3.1.2 GOstats_2.34.0 graph_1.46.0
[4] Category_2.34.2 Matrix_1.2-3 GO.db_3.1.2
[7] RSQLite_1.0.0 DBI_0.3.1 AnnotationDbi_1.30.1
[10] GenomeInfoDb_1.4.3 IRanges_2.2.9 S4Vectors_0.6.6
[13] Biobase_2.28.0 BiocGenerics_0.14.0 Humanzee_0.1.0
[16] biomaRt_2.24.1 broman_0.59-5 gridExtra_2.0.0
[19] matrixStats_0.15.0 ggplot2_1.0.1 edgeR_3.10.5
[22] limma_3.24.15 dplyr_0.4.3 data.table_1.9.6
[25] knitr_1.11
loaded via a namespace (and not attached):
[1] genefilter_1.50.0 reshape2_1.4.1 splines_3.2.1
[4] lattice_0.20-33 colorspace_1.2-6 htmltools_0.2.6
[7] yaml_2.1.13 survival_2.38-3 chron_2.3-47
[10] XML_3.98-1.3 RBGL_1.44.0 plyr_1.8.3
[13] stringr_1.0.0 munsell_0.4.2 gtable_0.1.2
[16] evaluate_0.8 labeling_0.3 highr_0.5.1
[19] GSEABase_1.30.2 proto_0.3-10 Rcpp_0.12.2
[22] xtable_1.8-0 scales_0.3.0 formatR_1.2.1
[25] annotate_1.46.1 digest_0.6.8 stringi_1.0-1
[28] tools_3.2.1 bitops_1.0-6 magrittr_1.5
[31] RCurl_1.95-4.7 MASS_7.3-45 assertthat_0.1
[34] rmarkdown_0.8.1 AnnotationForge_1.10.1 R6_2.1.1