Subsample: Number of genes detected - LCLs
2015-07-13
Last updated: 2015-07-13
Code version: a4d865fb33bba771e8c3bdcd182882556aedab55
The number of genes is detected in a subsampled set of single cells (both sequencing depth and number of cells is varied).
library("dplyr")
library("ggplot2")
theme_set(theme_bw(base_size = 14))
Batch process each subsampled data set
Run 10 iterations for each individual for each sequencing depth for each subsample of cells. The analysis is performed by detect-genes.R.
cd $ssd/lcl/multiplexed
mkdir -p genes-detected
mkdir -p ~/log/detect-genes.R
for NUM in 250000 500000 1000000 2000000 3000000 4000000
do
  for CELLS in 5 10 15 20 25 50
  do
    for SEED in {1..10}
    do
      # Molecules
      CMD="detect-genes.R $CELLS $SEED molecule-counts-$NUM.txt --min_count=1 --min_cells=5 --good_cells=/mnt/lustre/home/jdblischak/singleCellSeq/data/quality-single-cells-lcl.txt"
      DEST="genes-detected/molecule-$CELLS-$SEED-$NUM.txt"
      echo "$CMD > $DEST" | qsub -l h_vmem=2g -cwd -V -N detect-molecule-$CELLS-$SEED-$NUM -j y -o ~/log/detect-genes.R -l 'hostname=!bigmem01'
      sleep .01s
      # Reads
      CMD="detect-genes.R $CELLS $SEED read-counts-$NUM.txt --min_count=10 --min_cells=5 --good_cells=/mnt/lustre/home/jdblischak/singleCellSeq/data/quality-single-cells-lcl.txt"
      DEST="genes-detected/read-$CELLS-$SEED-$NUM.txt"
      echo "$CMD > $DEST" | qsub -l h_vmem=2g -cwd -V -N detect-read-$CELLS-$SEED-$NUM -j y -o ~/log/detect-genes.R -l 'hostname=!bigmem01'
      sleep .01s
    done
  done
done
Convert to one file using Python. Run from $ssd/lcl/multiplexed.
import os
import glob
files = glob.glob("genes-detected/*txt")
out = open("genes-detected.txt", "w")
out.write("type\tdepth\tnum_cells\tseed\tgenes\tmean_counts\n")
for fname in files:
    fname_parts = os.path.basename(fname).rstrip(".txt").split("-")
    type = fname_parts[0]
    depth = fname_parts[3]
    f = open(fname, "r")
    out.write(type + "\t" + depth + "\t" + f.read())
    f.close()

out.close()
Number of genes detected
genes_data <- read.table("/mnt/gluster/data/internal_supp/singleCellSeq/lcl/multiplexed/genes-detected.txt",
                         header = TRUE, sep = "\t", stringsAsFactors = FALSE)
Calculate the mean and standard error of the mean (sem) for each of the 10 iterations.
genes_data_plot <- genes_data %>%
  group_by(type, depth, num_cells) %>%
  summarize(mean = mean(genes), sem = sd(genes) / sqrt(length(genes)))
For the analysis of read counts, a gene was detected if it had greater than 10 reads in at least 5 cells. For the analysis of molecule counts, a gene was detected if it had greater than 1 molecule in at least 5 cells.
p <- ggplot(genes_data_plot, aes(x = num_cells, y = mean, color = as.factor(depth))) +
  geom_line() +
  geom_errorbar(aes(ymin = mean - sem, ymax = mean + sem), width = 1) +
  facet_grid(~type) +
  labs(x = "Number of subsampled cells",
       y = "Number of genes detected",
       color = "Depth",
       title = "Subsample: Number of genes detected")
p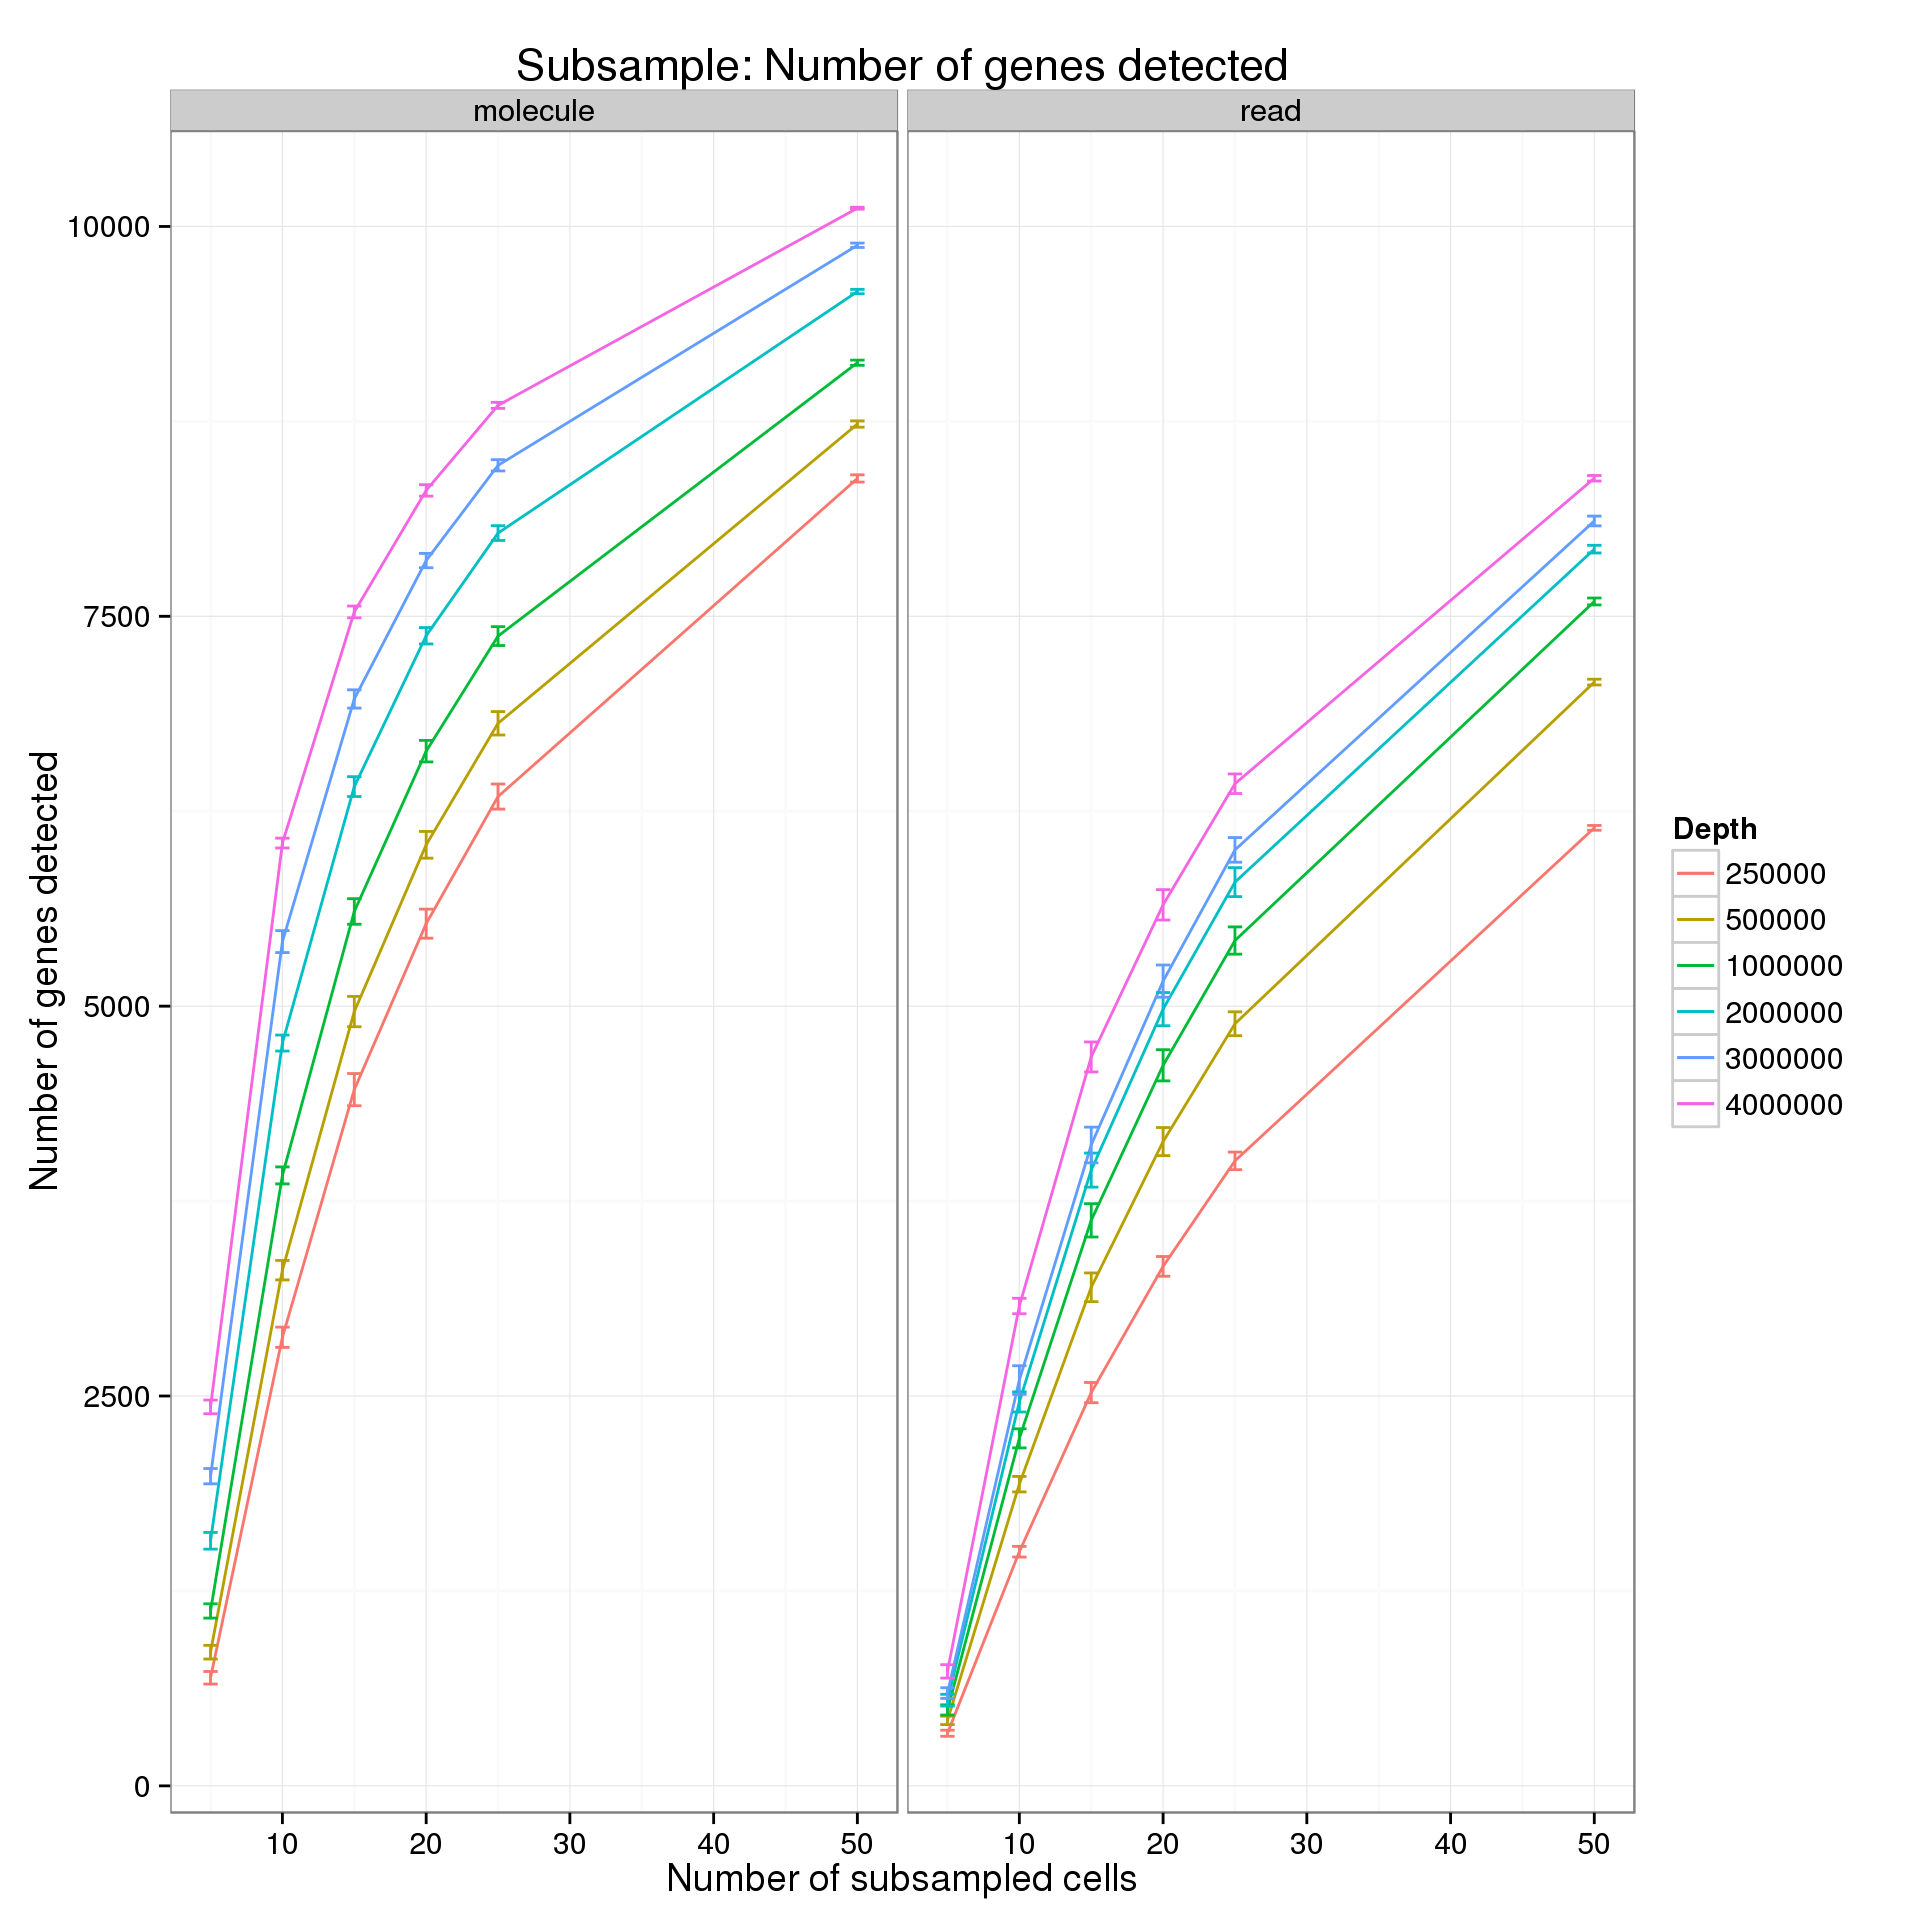
Mean number of total counts
Explore the effect of subsampling sequencing depth and number of cells on the mean total count. Only includes counts of genes which had the minumum count (10 reads; 1 molecule) in the minimum number of cells (5).
Calculate the mean and standard error of the mean (sem) for each of the 10 iterations.
mean_counts_data_plot <- genes_data %>%
  group_by(type, depth, num_cells) %>%
  summarize(mean = mean(mean_counts), sem = sd(mean_counts) / sqrt(length(mean_counts)))
Results for a minimum count of 10 reads or 1 molecule and a minumum number of cells of 5.
p %+% mean_counts_data_plot +
  labs(y = "Mean total count",
       title = "Subsample: Mean total count")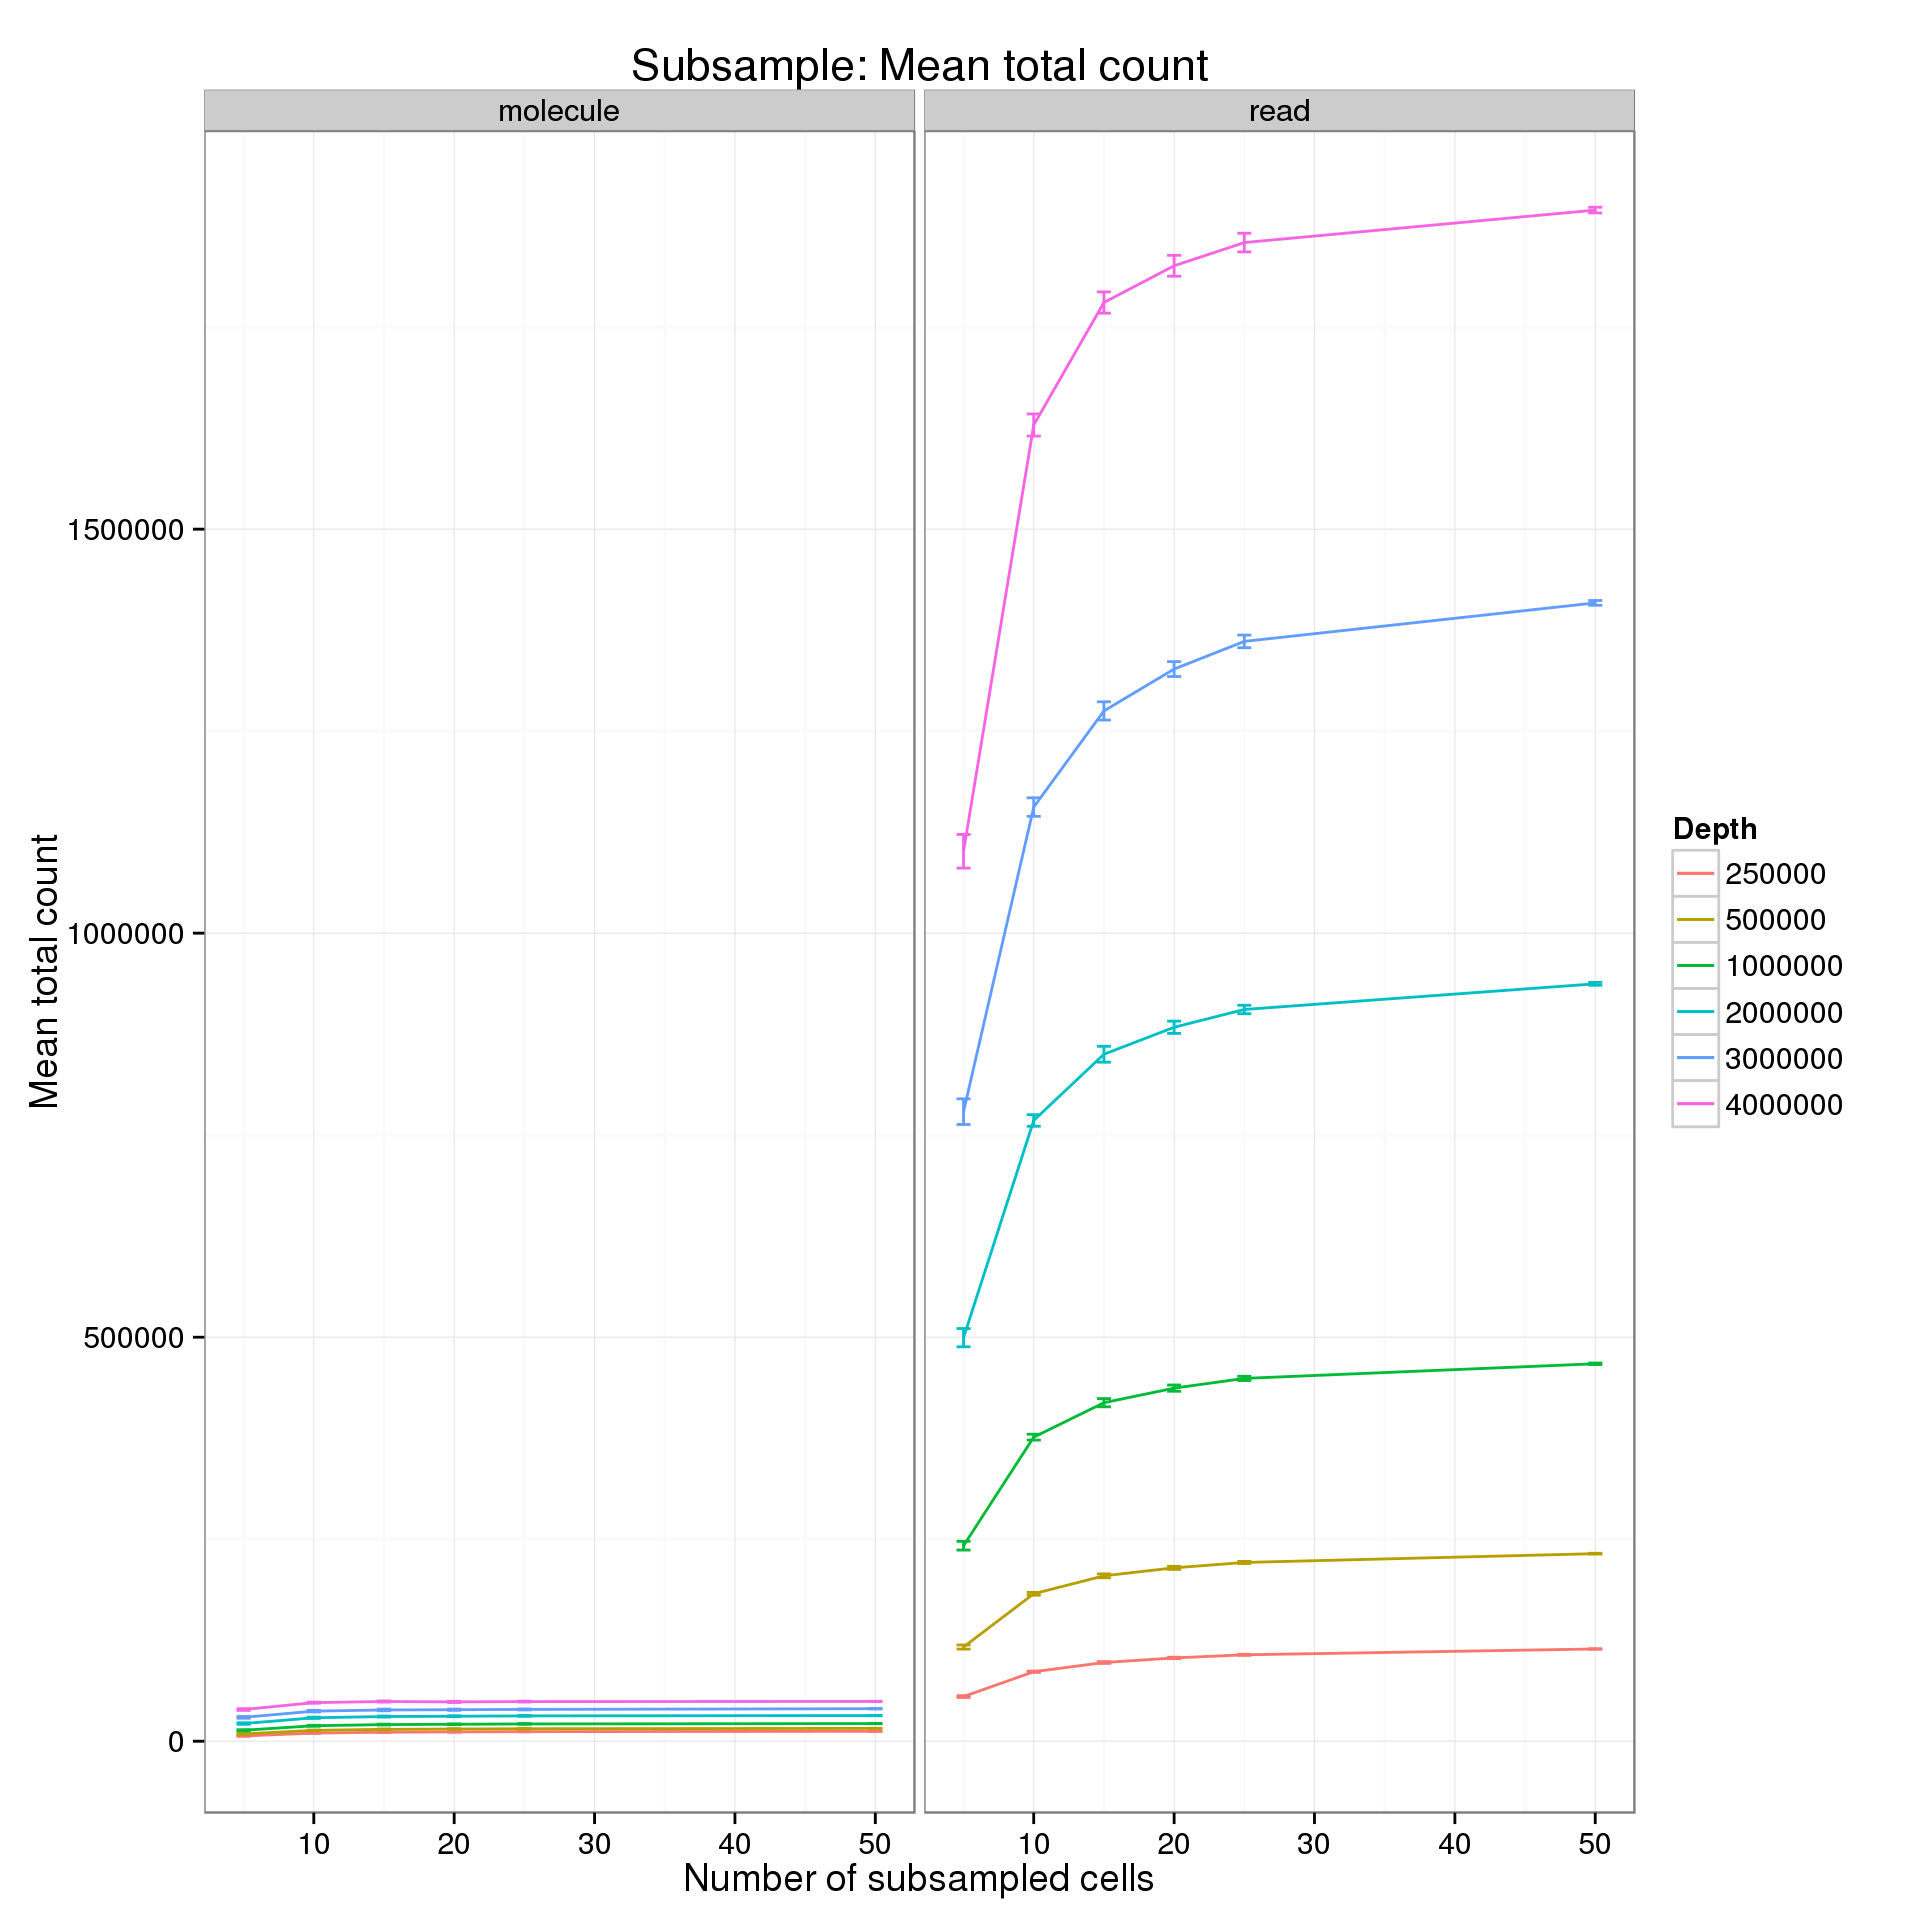
It’s difficult to see the differences in the molecule counts because of the range of the y-axis. Here is the molecule counts alone.
p %+% mean_counts_data_plot[mean_counts_data_plot$type == "molecule", ] +
  labs(y = "Mean total count",
       title = "Subsample: Mean total count, molecules only")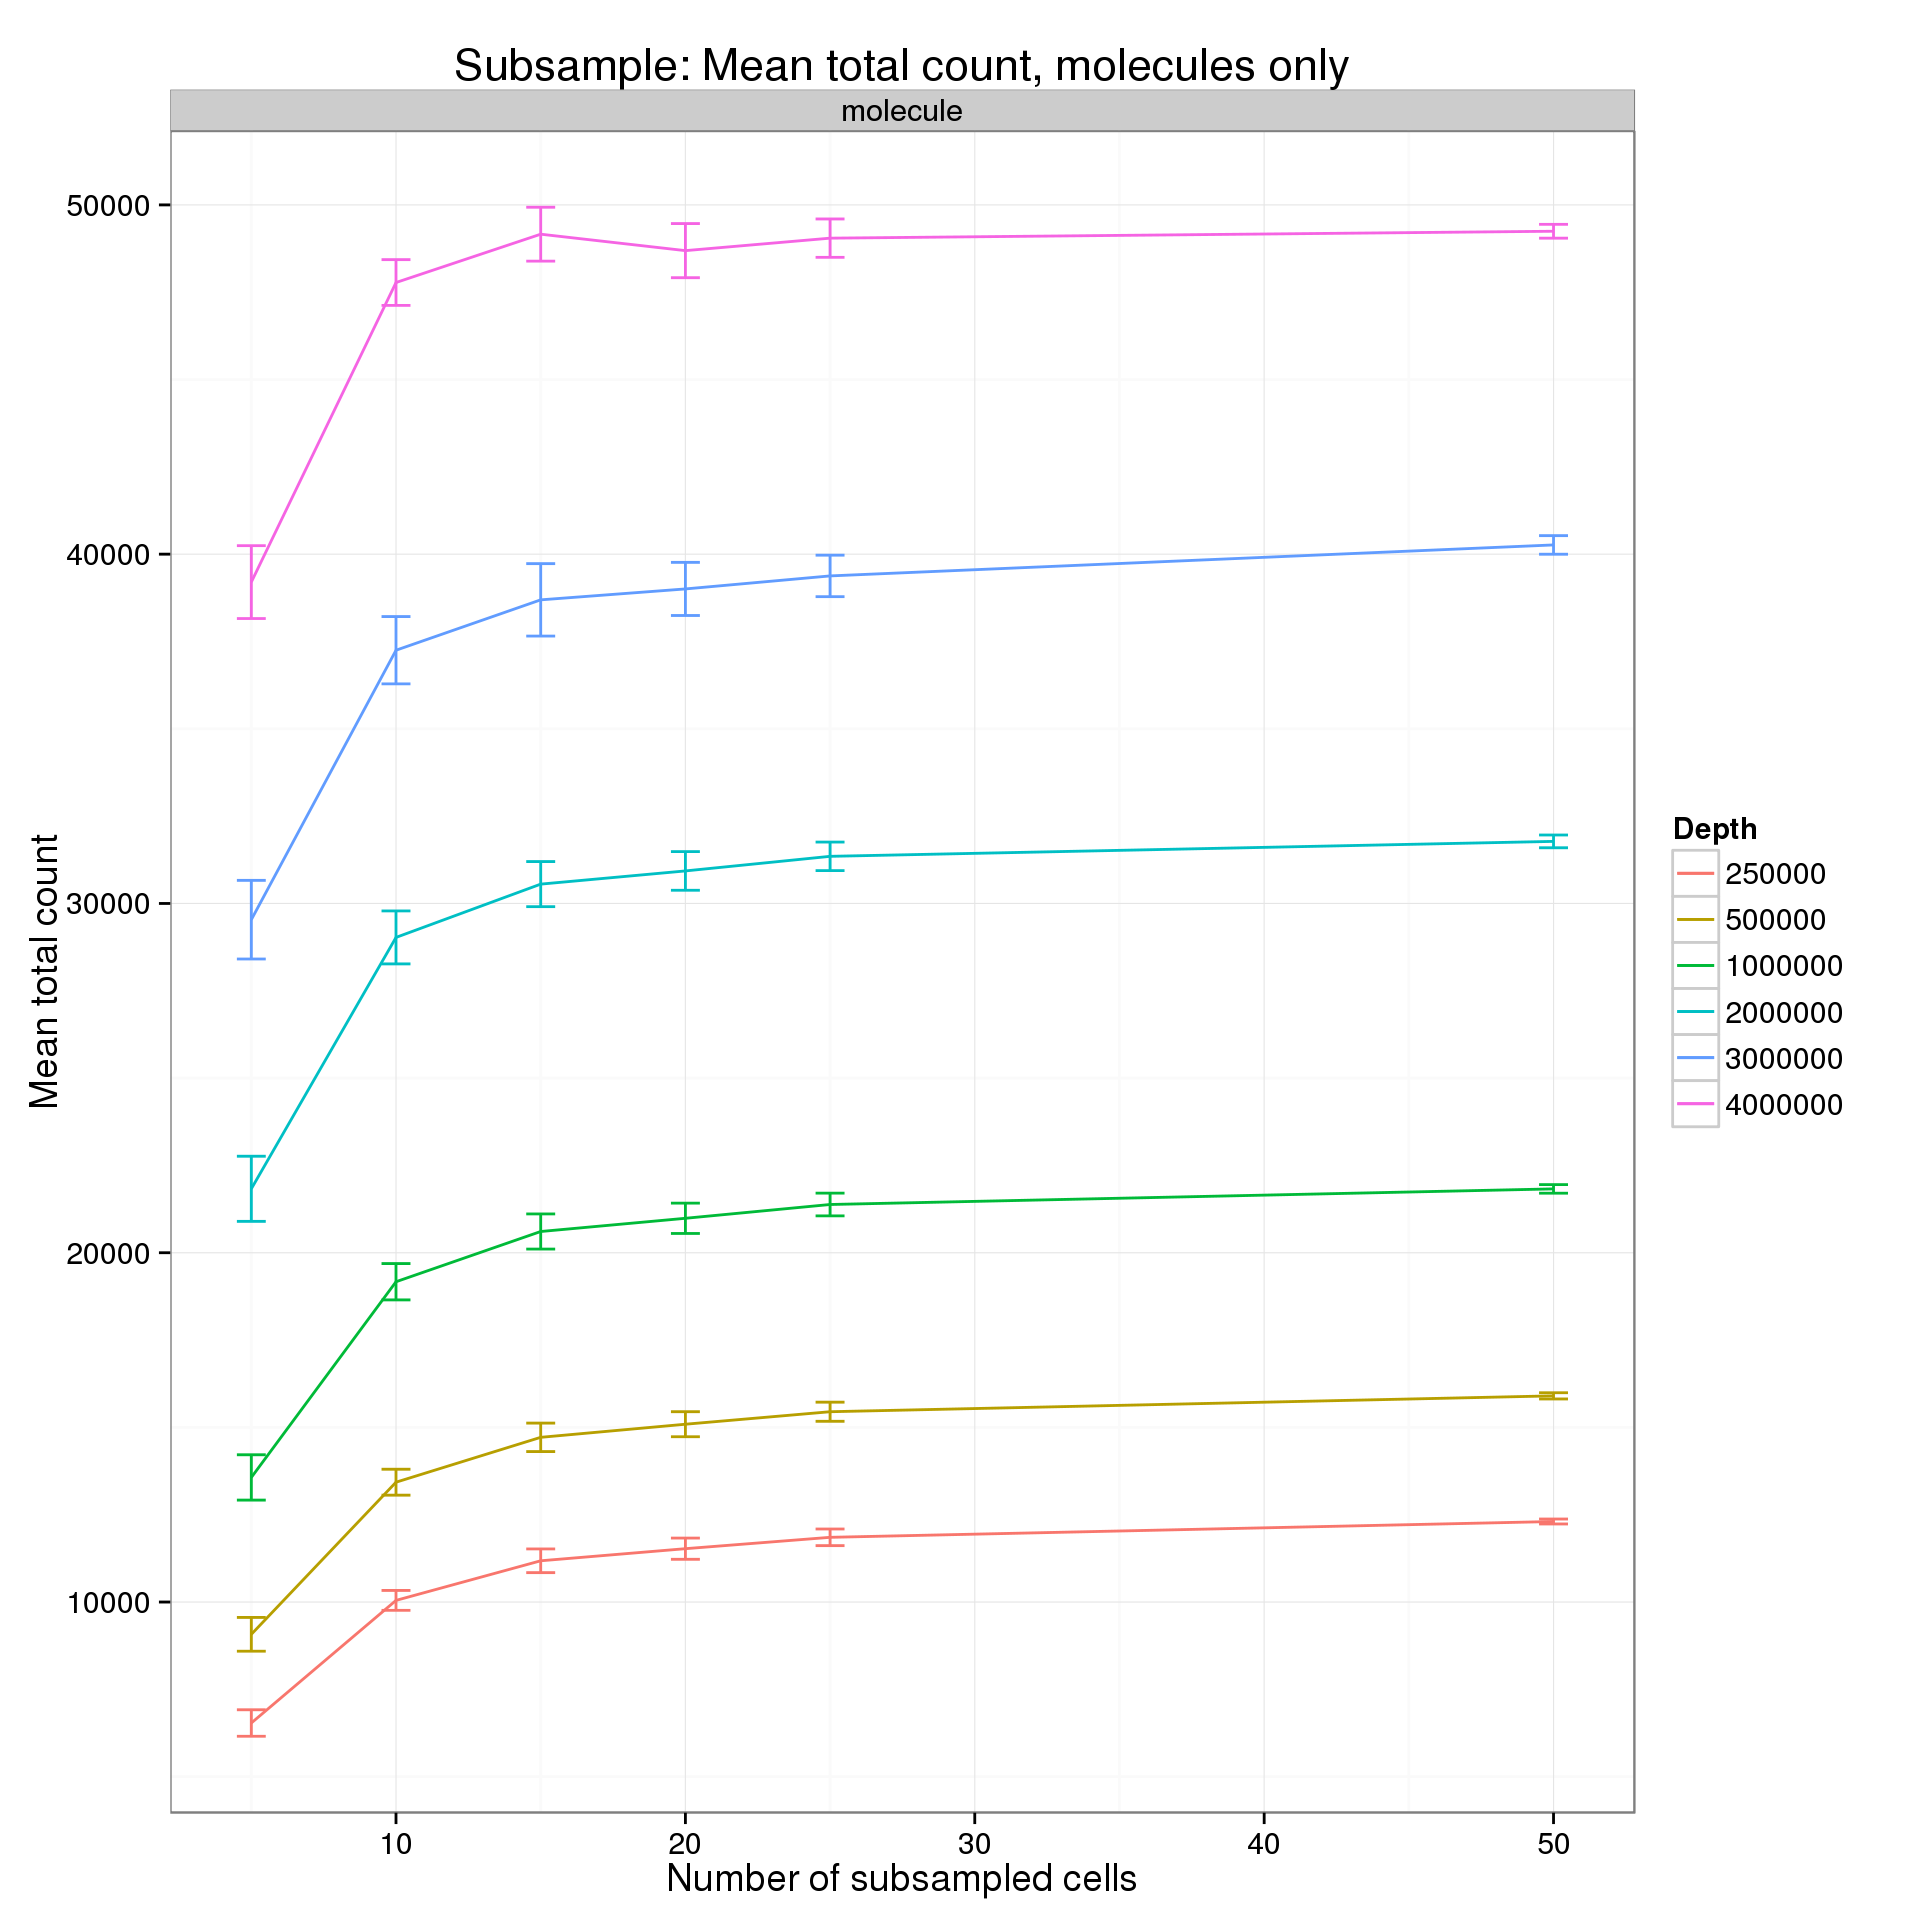
Keeping the number of subsampled cells constant to focus specifically on changes in sequencing depth.
p_box <- ggplot(genes_data[genes_data$type == "molecule" &
                           genes_data$num_cells %in% c(5, 25, 50), ],
                aes(x = as.factor(depth), y = mean_counts)) +
  geom_boxplot() +
  facet_grid(num_cells~type) +
  labs(x = "Depth", y = "Mean total count",
       title = "Effect of sequencing depth on mean total molecule count")
p_box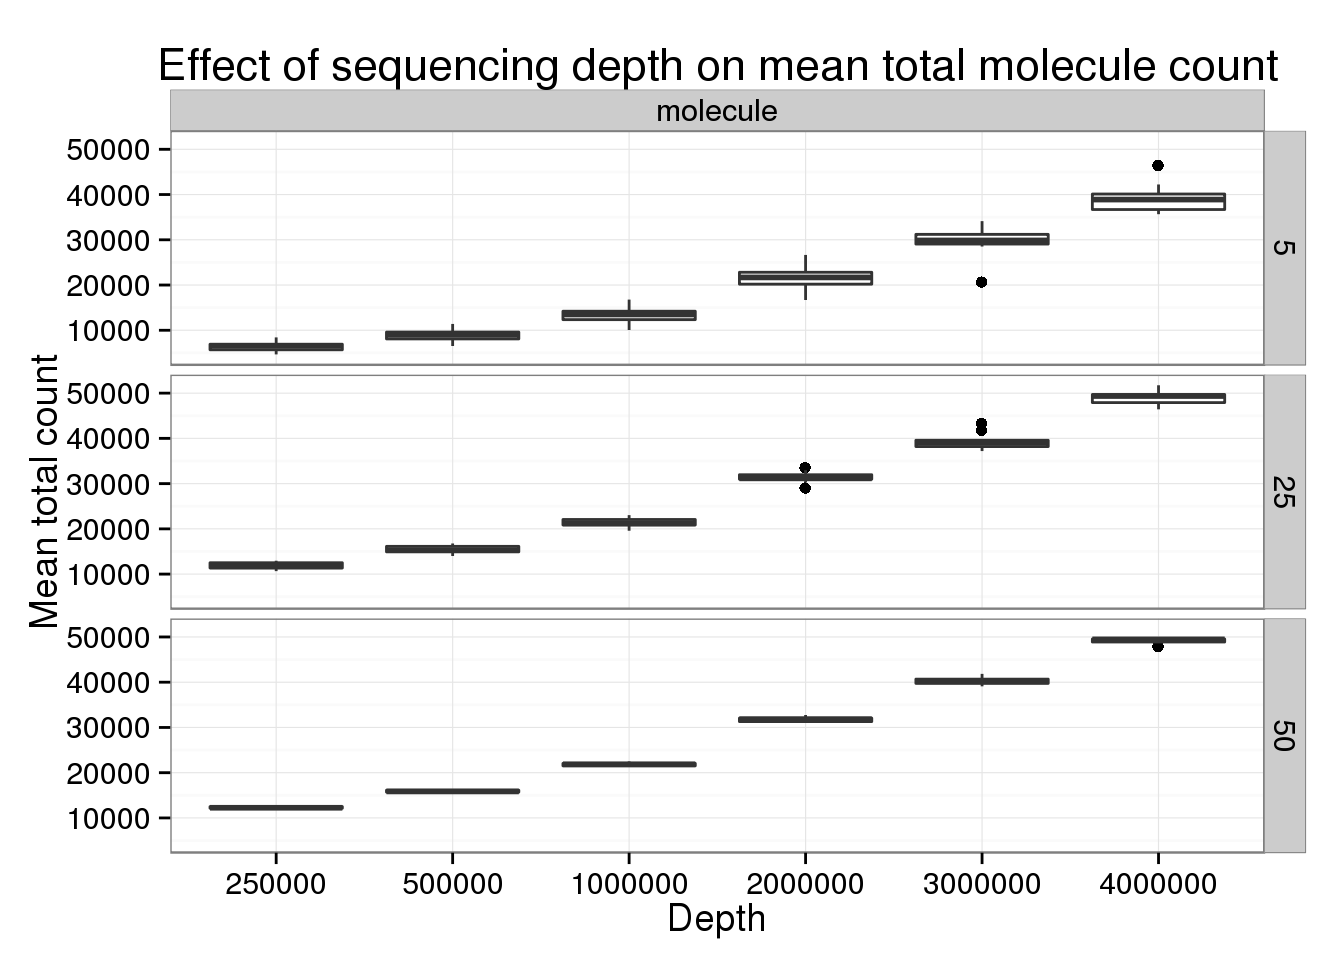
p_box %+% genes_data[genes_data$type == "read" &
                  genes_data$num_cells %in% c(5, 25, 50), ] +
  labs(title = "Effect of sequencing depth on mean total read count")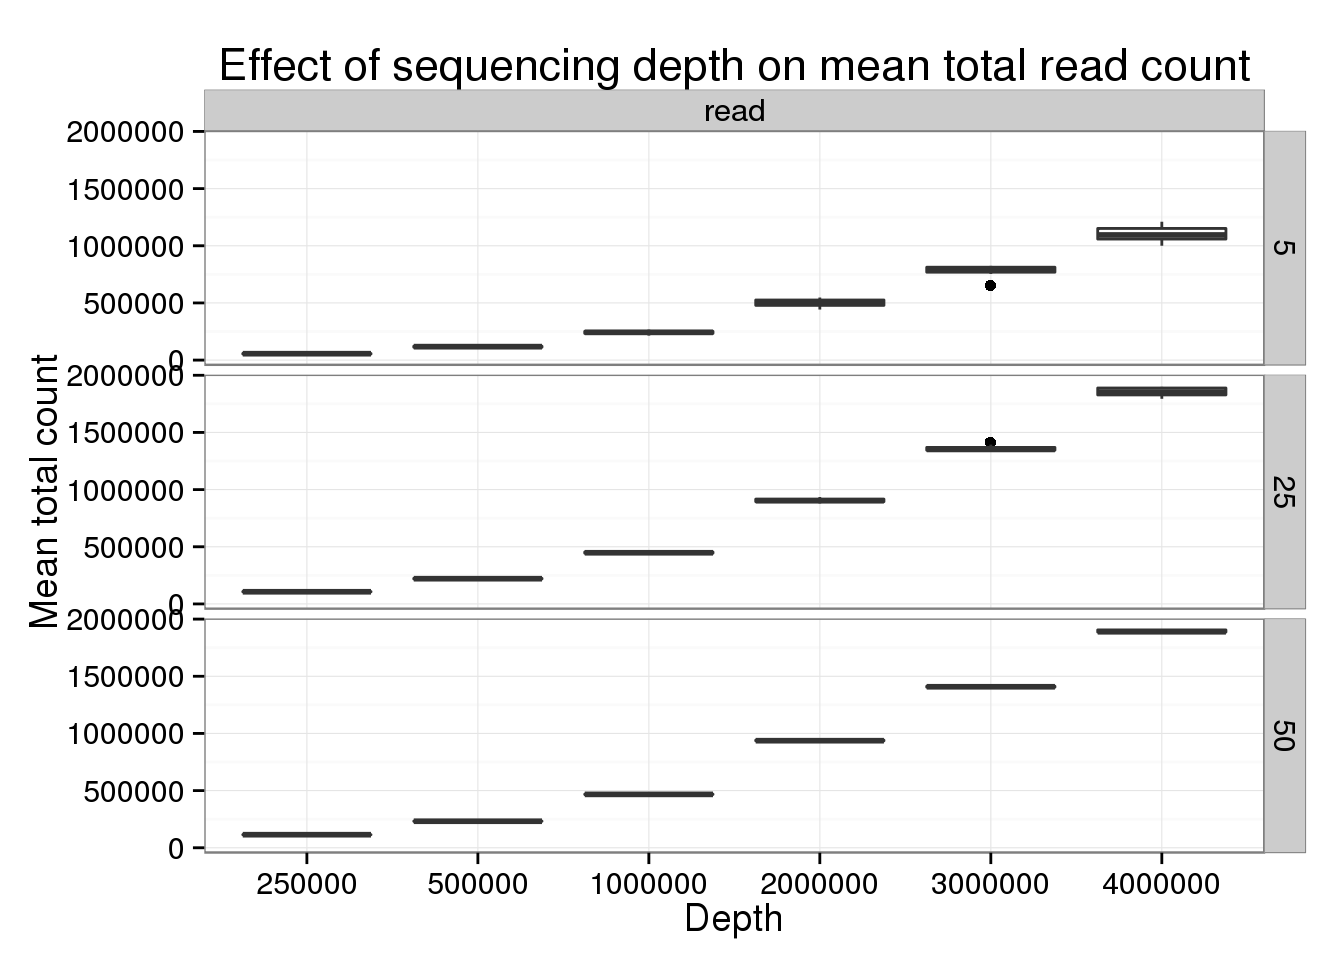
Session information
sessionInfo()R version 3.2.0 (2015-04-16)
Platform: x86_64-unknown-linux-gnu (64-bit)
locale:
[1] LC_CTYPE=en_US.UTF-8 LC_NUMERIC=C
[3] LC_TIME=en_US.UTF-8 LC_COLLATE=en_US.UTF-8
[5] LC_MONETARY=en_US.UTF-8 LC_MESSAGES=en_US.UTF-8
[7] LC_PAPER=en_US.UTF-8 LC_NAME=C
[9] LC_ADDRESS=C LC_TELEPHONE=C
[11] LC_MEASUREMENT=en_US.UTF-8 LC_IDENTIFICATION=C
attached base packages:
[1] stats graphics grDevices utils datasets methods base
other attached packages:
[1] ggplot2_1.0.1 dplyr_0.4.1 knitr_1.10.5
loaded via a namespace (and not attached):
[1] Rcpp_0.11.6 magrittr_1.5 MASS_7.3-40 munsell_0.4.2
[5] colorspace_1.2-6 stringr_1.0.0 plyr_1.8.2 tools_3.2.0
[9] parallel_3.2.0 grid_3.2.0 gtable_0.1.2 DBI_0.3.1
[13] htmltools_0.2.6 yaml_2.1.13 lazyeval_0.1.10 assertthat_0.1
[17] digest_0.6.8 reshape2_1.4.1 formatR_1.2 evaluate_0.7
[21] rmarkdown_0.6.1 labeling_0.3 stringi_0.4-1 scales_0.2.4
[25] proto_0.3-10