Subsample: Number of genes detected
2015-07-03
Last updated: 2015-07-14
Code version: c15d3f51fff8752a21b1cbfd0f936fe0a2c5fac9
The number of genes is detected in a subsampled set of single cells (both sequencing depth and number of cells is varied).
library("dplyr")
library("ggplot2")
theme_set(theme_bw(base_size = 14))
Batch process each subsampled data set
Run 10 iterations for each individual for each sequencing depth for each subsample of cells. The analysis is performed by detect-genes.R.
cd $ssd/subsampled
mkdir -p genes-detected
mkdir -p ~/log/detect-genes.R
for IND in 19098 19101 19239
do
  for NUM in 200000 400000 1000000 2000000 3000000 4000000
  do
    for CELLS in 5 10 15 20 25 50 75 100 125 150
    do
      for SEED in {1..10}
      do
        for MIN_CELLS in 1 5 10 15
        do
          if [[ $CELLS -gt $MIN_CELLS || $CELLS -eq $MIN_CELLS ]]
          then
              # Molecules
              CMD="detect-genes.R $CELLS $SEED molecule-counts-$NUM.txt --individual=$IND --min_count=1 --min_cells=$MIN_CELLS --good_cells=/mnt/lustre/home/jdblischak/singleCellSeq/data/quality-single-cells.txt"
              DEST="genes-detected/molecule-$IND-$CELLS-$SEED-$NUM-$MIN_CELLS.txt"
              echo "$CMD > $DEST" | qsub -l h_vmem=2g -cwd -V -N detect-molecule-$IND-$CELLS-$SEED-$NUM-$MIN_CELLS -j y -o ~/log/detect-genes.R -l 'hostname=!bigmem01'
              sleep .01s
              # Reads
              CMD="detect-genes.R $CELLS $SEED read-counts-$NUM.txt --individual=$IND --min_count=10 --min_cells=$MIN_CELLS --good_cells=/mnt/lustre/home/jdblischak/singleCellSeq/data/quality-single-cells.txt"
              DEST="genes-detected/read-$IND-$CELLS-$SEED-$NUM-$MIN_CELLS.txt"
              echo "$CMD > $DEST" | qsub -l h_vmem=2g -cwd -V -N detect-read-$IND-$CELLS-$SEED-$NUM-$MIN_CELLS -j y -o ~/log/detect-genes.R -l 'hostname=!bigmem01'
              sleep .01s
          fi
        done
      done
    done
  done
done
Convert to one file using Python. Run from $ssd/subsampled.
import os
import glob
files = glob.glob("genes-detected/*txt")
out = open("genes-detected.txt", "w")
out.write("type\tind\tdepth\tmin_cells\tnum_cells\tseed\tgenes\tmean_counts\n")
for fname in files:
    fname_parts = os.path.basename(fname).rstrip(".txt").split("-")
    type = fname_parts[0]
    ind = fname_parts[1]
    depth = fname_parts[4]
    min_cells = fname_parts[5]
    f = open(fname, "r")
    out.write(type + "\t" + ind + "\t" + depth + "\t" + min_cells + "\t" + f.read())
    f.close()

out.close()
Number of genes detected
genes_data <- read.table("/mnt/gluster/data/internal_supp/singleCellSeq/subsampled/genes-detected.txt",
                         header = TRUE, sep = "\t", stringsAsFactors = FALSE)
Calculate the mean and standard error of the mean (sem) for each of the 10 iterations.
genes_data_plot <- genes_data %>%
  group_by(type, ind, min_cells, depth, num_cells) %>%
  summarize(mean = mean(genes), sem = sd(genes) / sqrt(length(genes)))
For the analysis of read counts, a gene was detected if it had greater than 10 reads in at least the minumum number of cells. For the analysis of molecule counts, a gene was detected if it had greater than 1 molecule in at least the minimum number of cells.
Minimum cells of 1
p <- ggplot(genes_data_plot[genes_data_plot$min_cells == 1, ], aes(x = num_cells, y = mean, color = as.factor(depth))) +
  geom_line() +
  geom_errorbar(aes(ymin = mean - sem, ymax = mean + sem), width = 1) +
  facet_grid(type~ind) +
  labs(x = "Number of subsampled cells",
       y = "Number of genes detected",
       color = "Depth",
       title = "Subsample: Number of genes detected in at least 1 cell")
p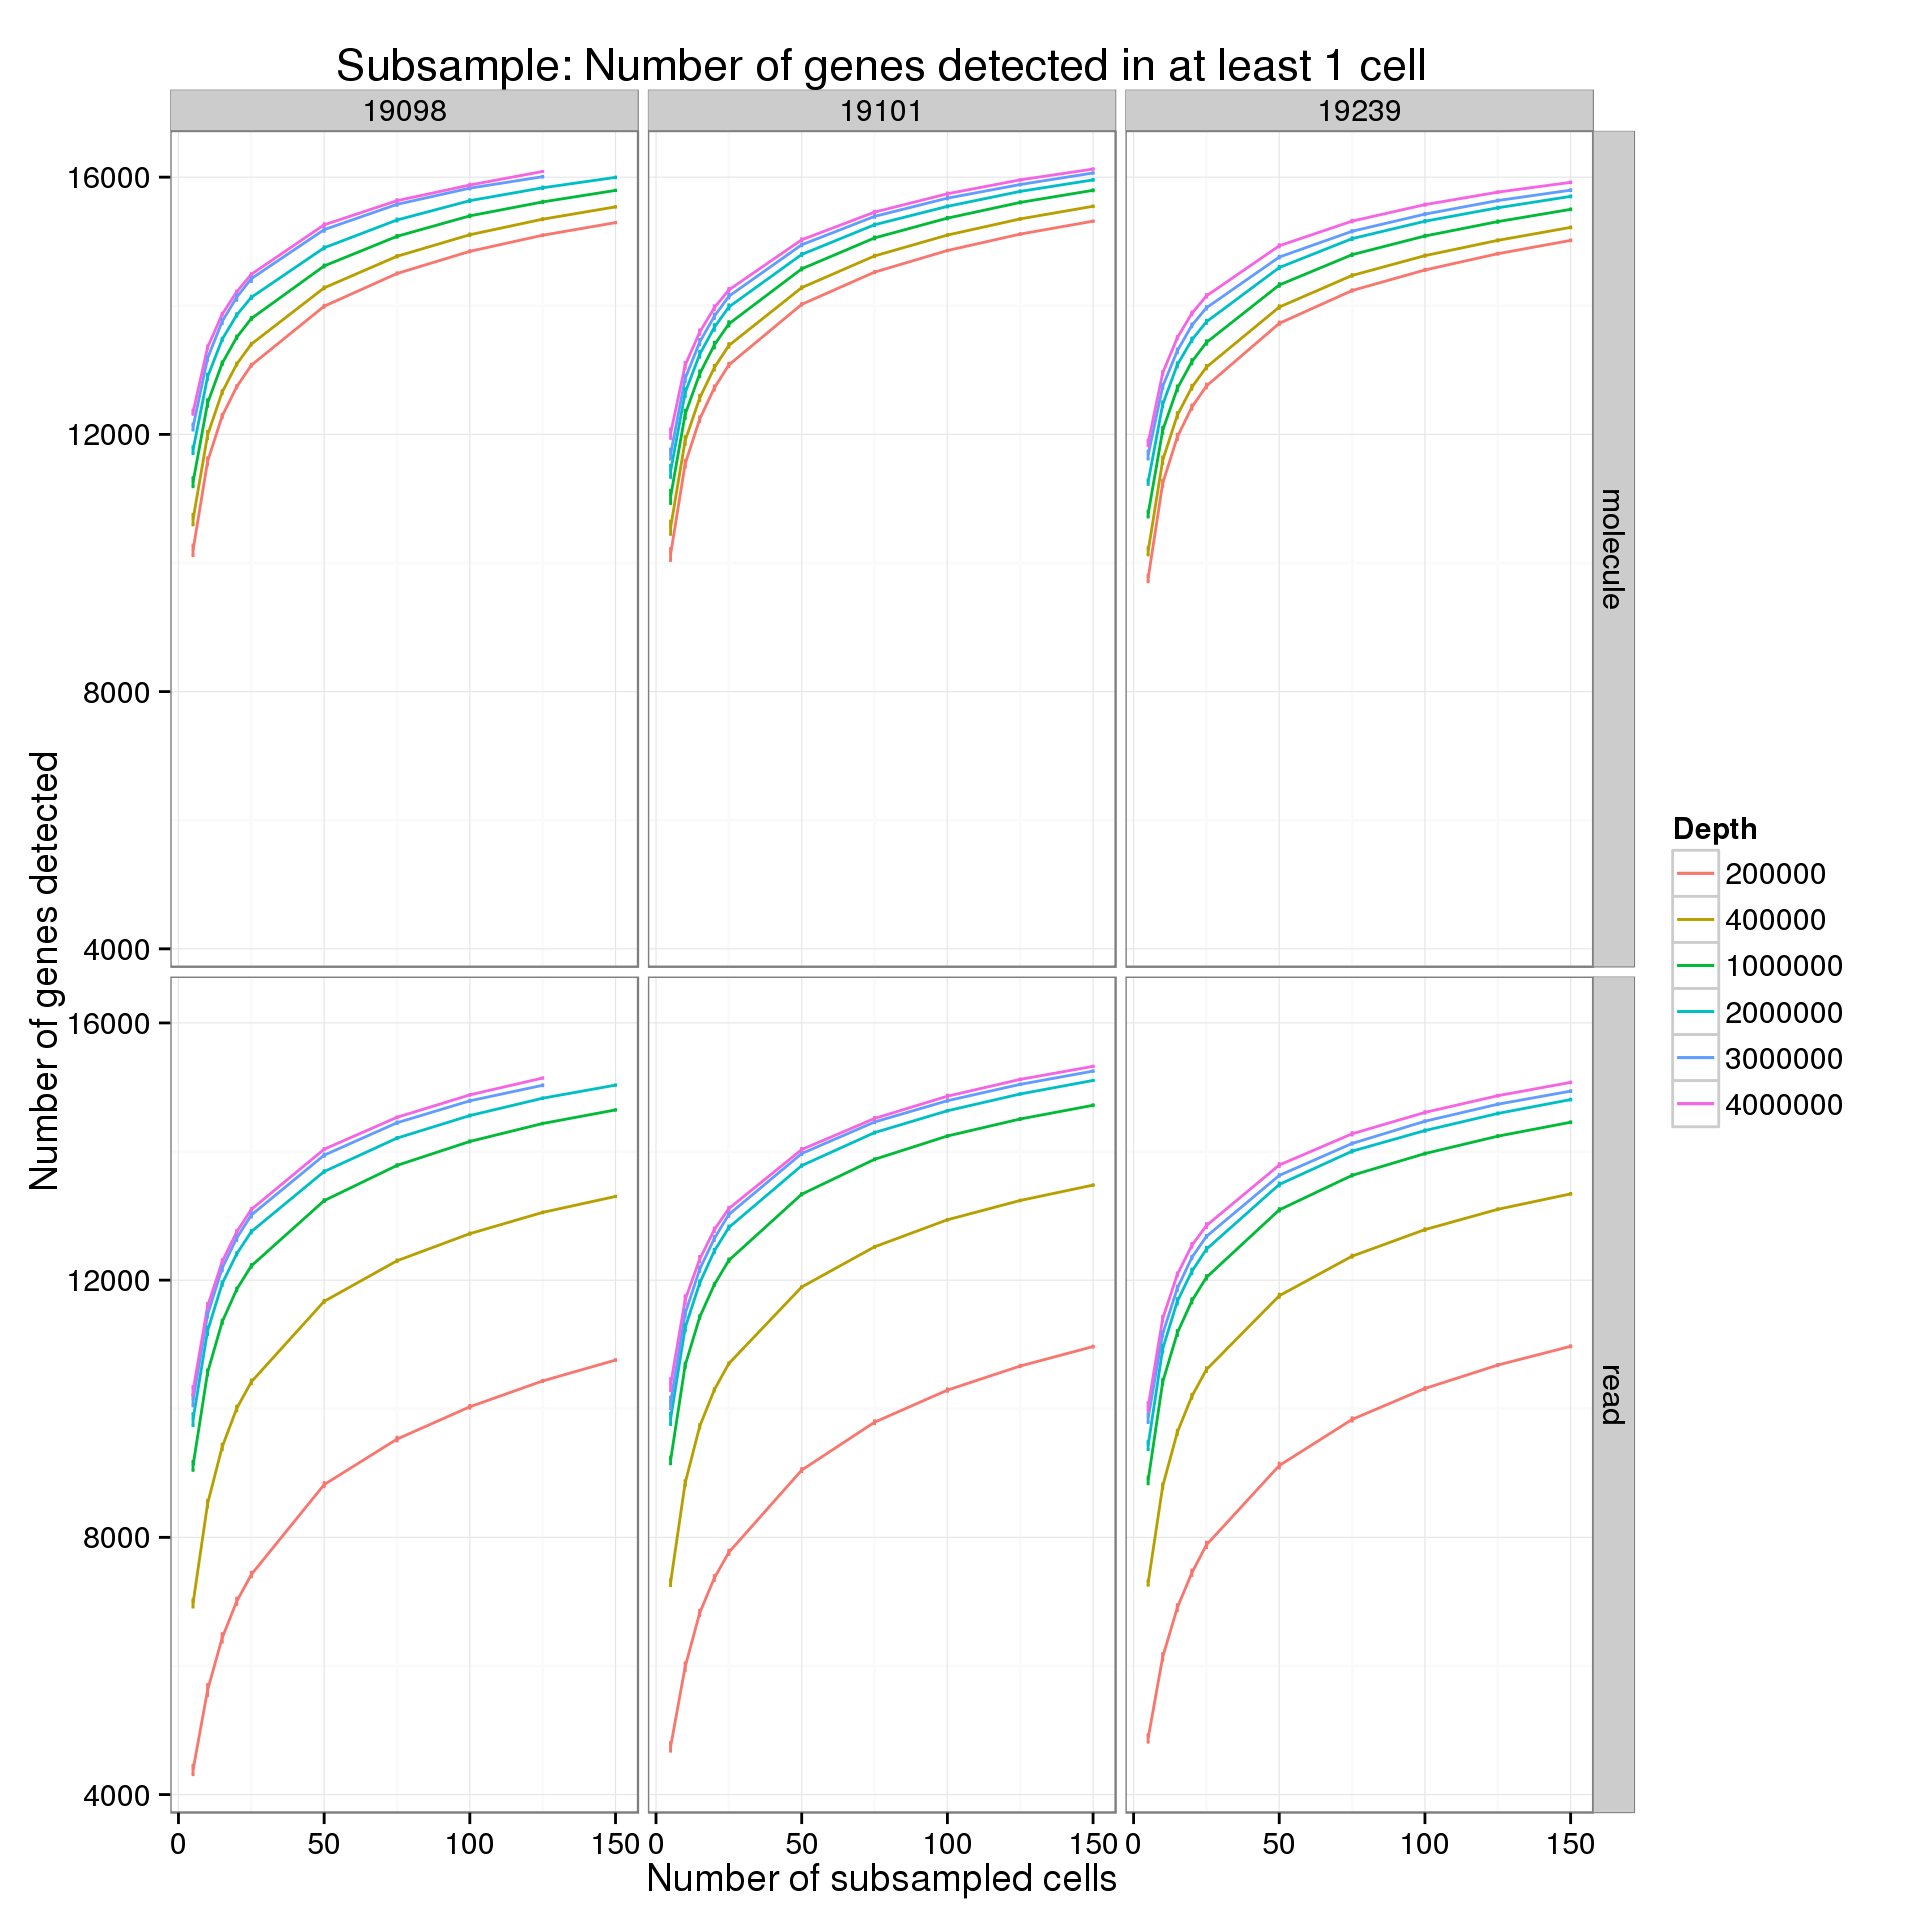
Minimum cells of 5
p %+% genes_data_plot[genes_data_plot$min_cells == 5, ] +
  labs(title = "Subsample: Number of genes detected in at least of 5 cells")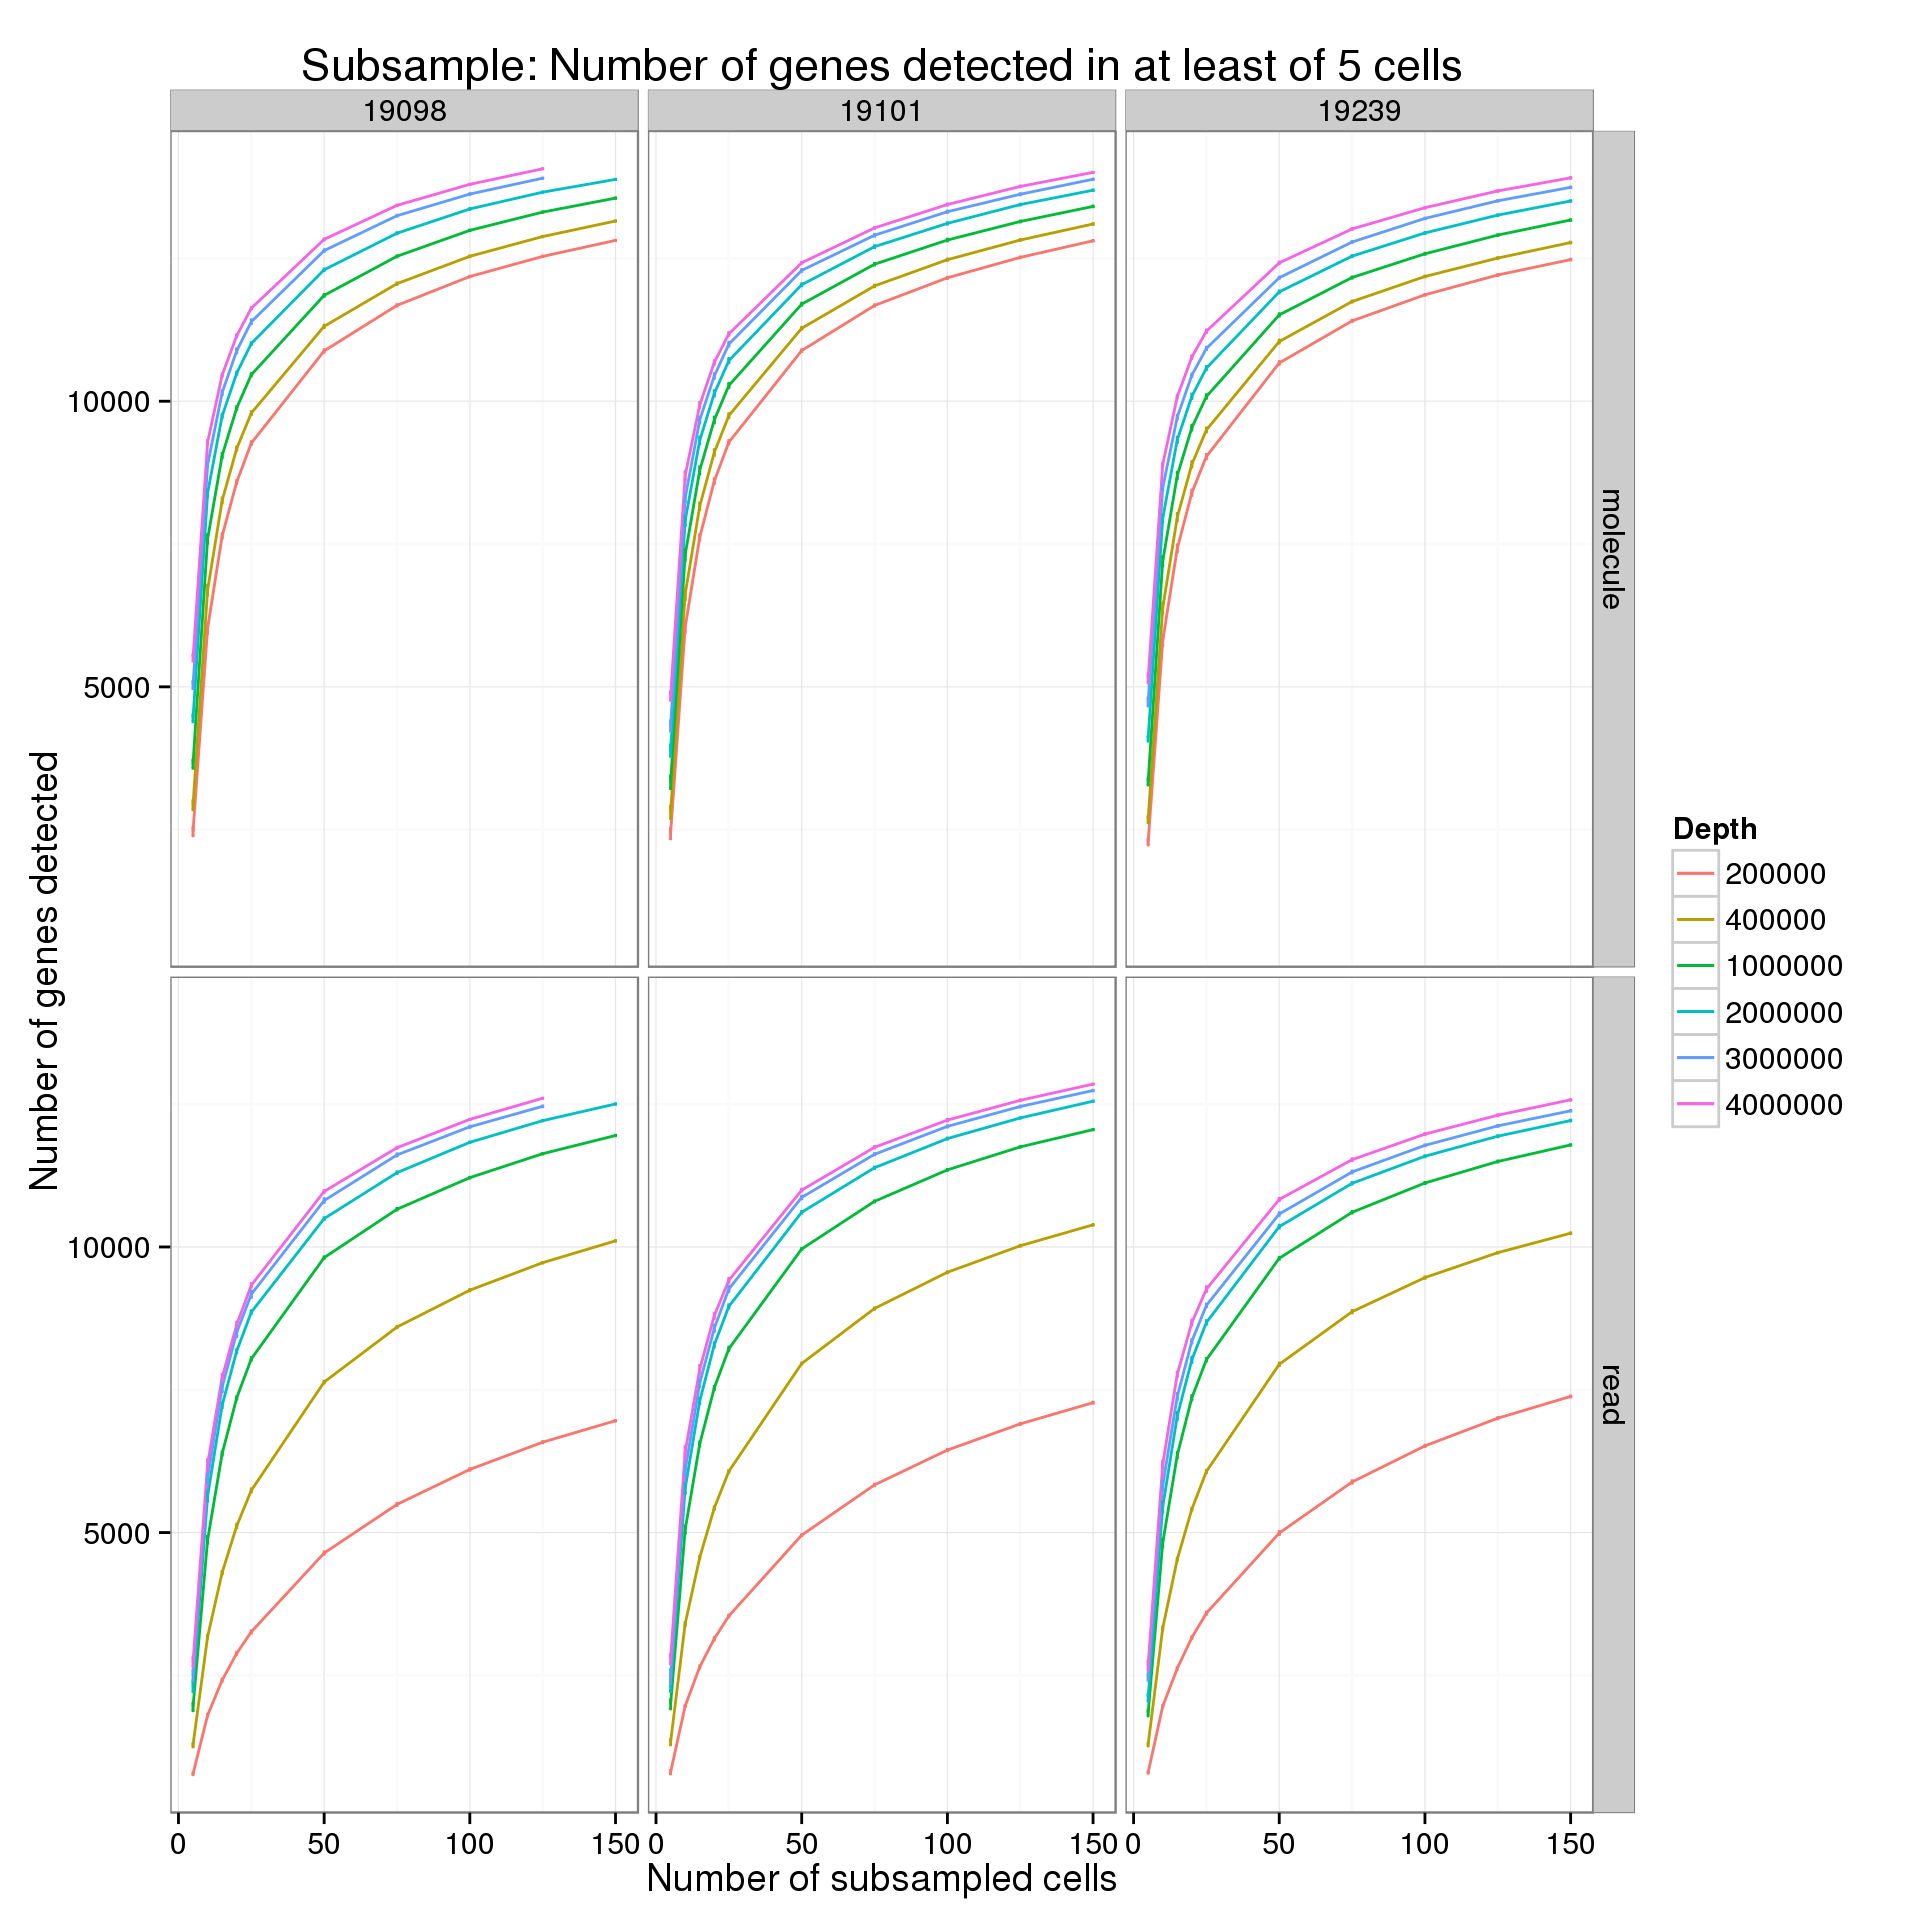
Minimum cells of 10
p %+% genes_data_plot[genes_data_plot$min_cells == 10, ] +
  labs(title = "Subsample: Number of genes detected in at least of 10 cells")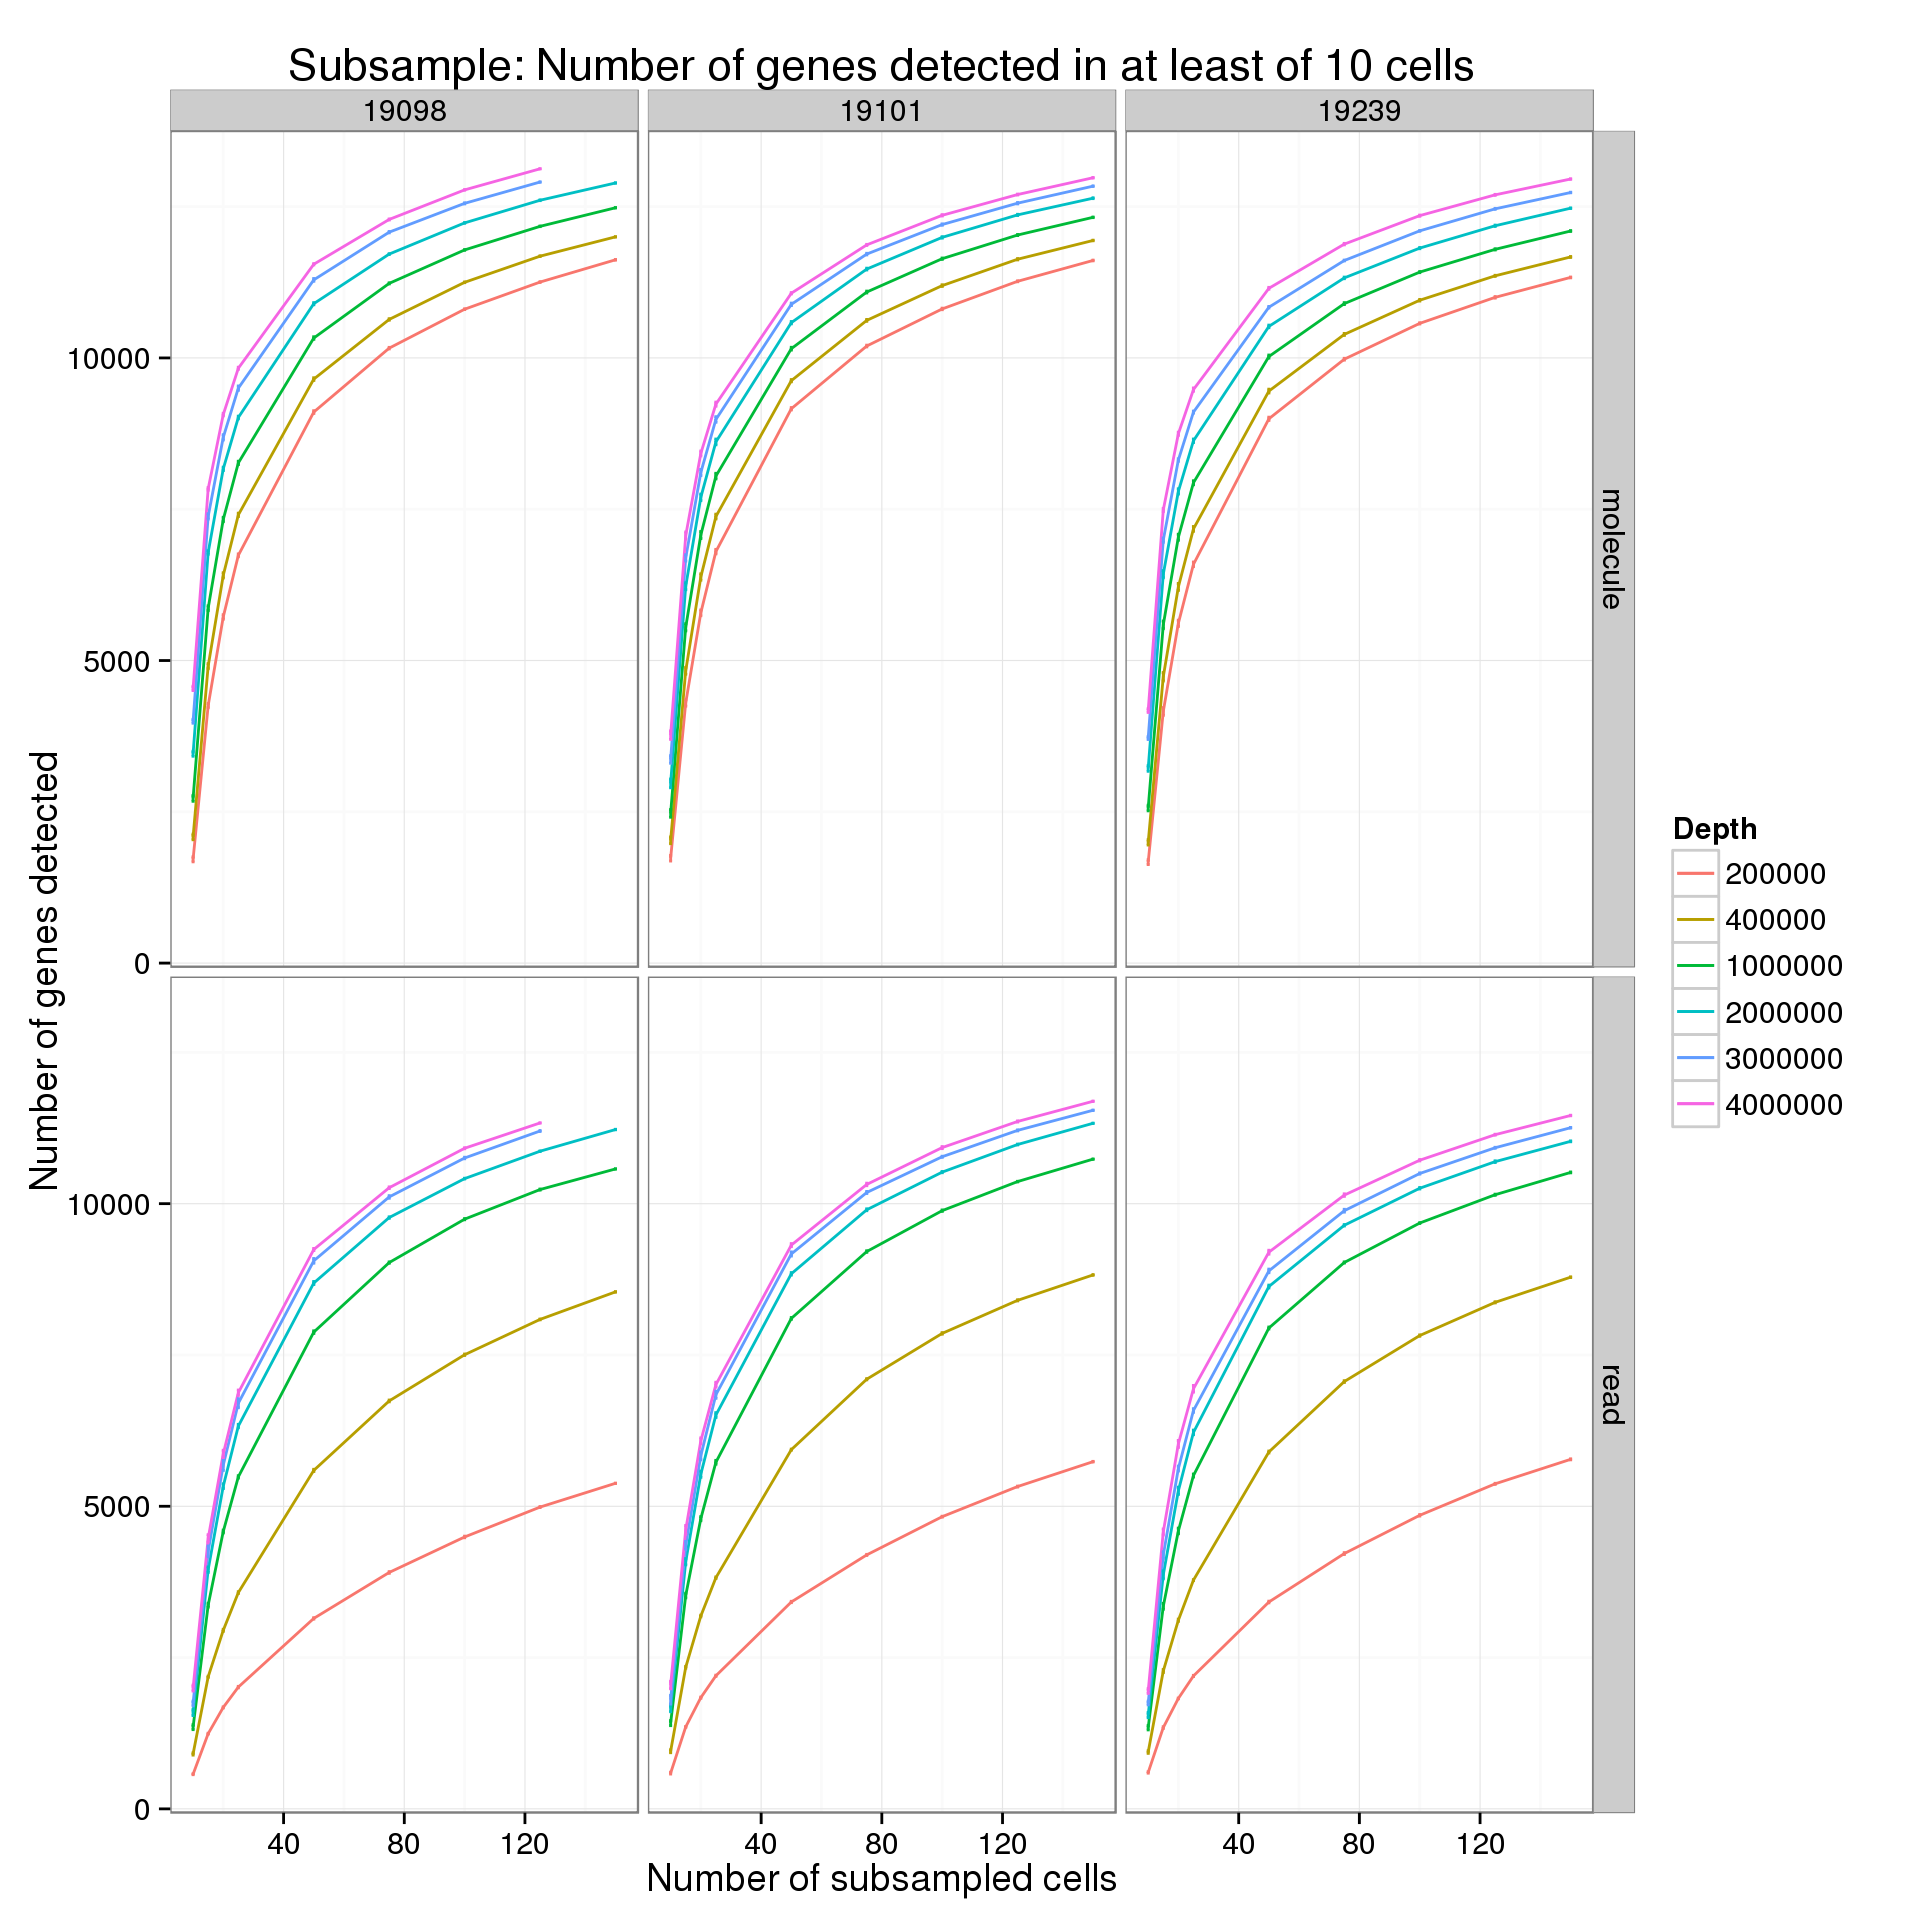
Minimum cells of 15
p %+% genes_data_plot[genes_data_plot$min_cells == 15, ] +
  labs(title = "Subsample: Number of genes detected in at least of 15 cells")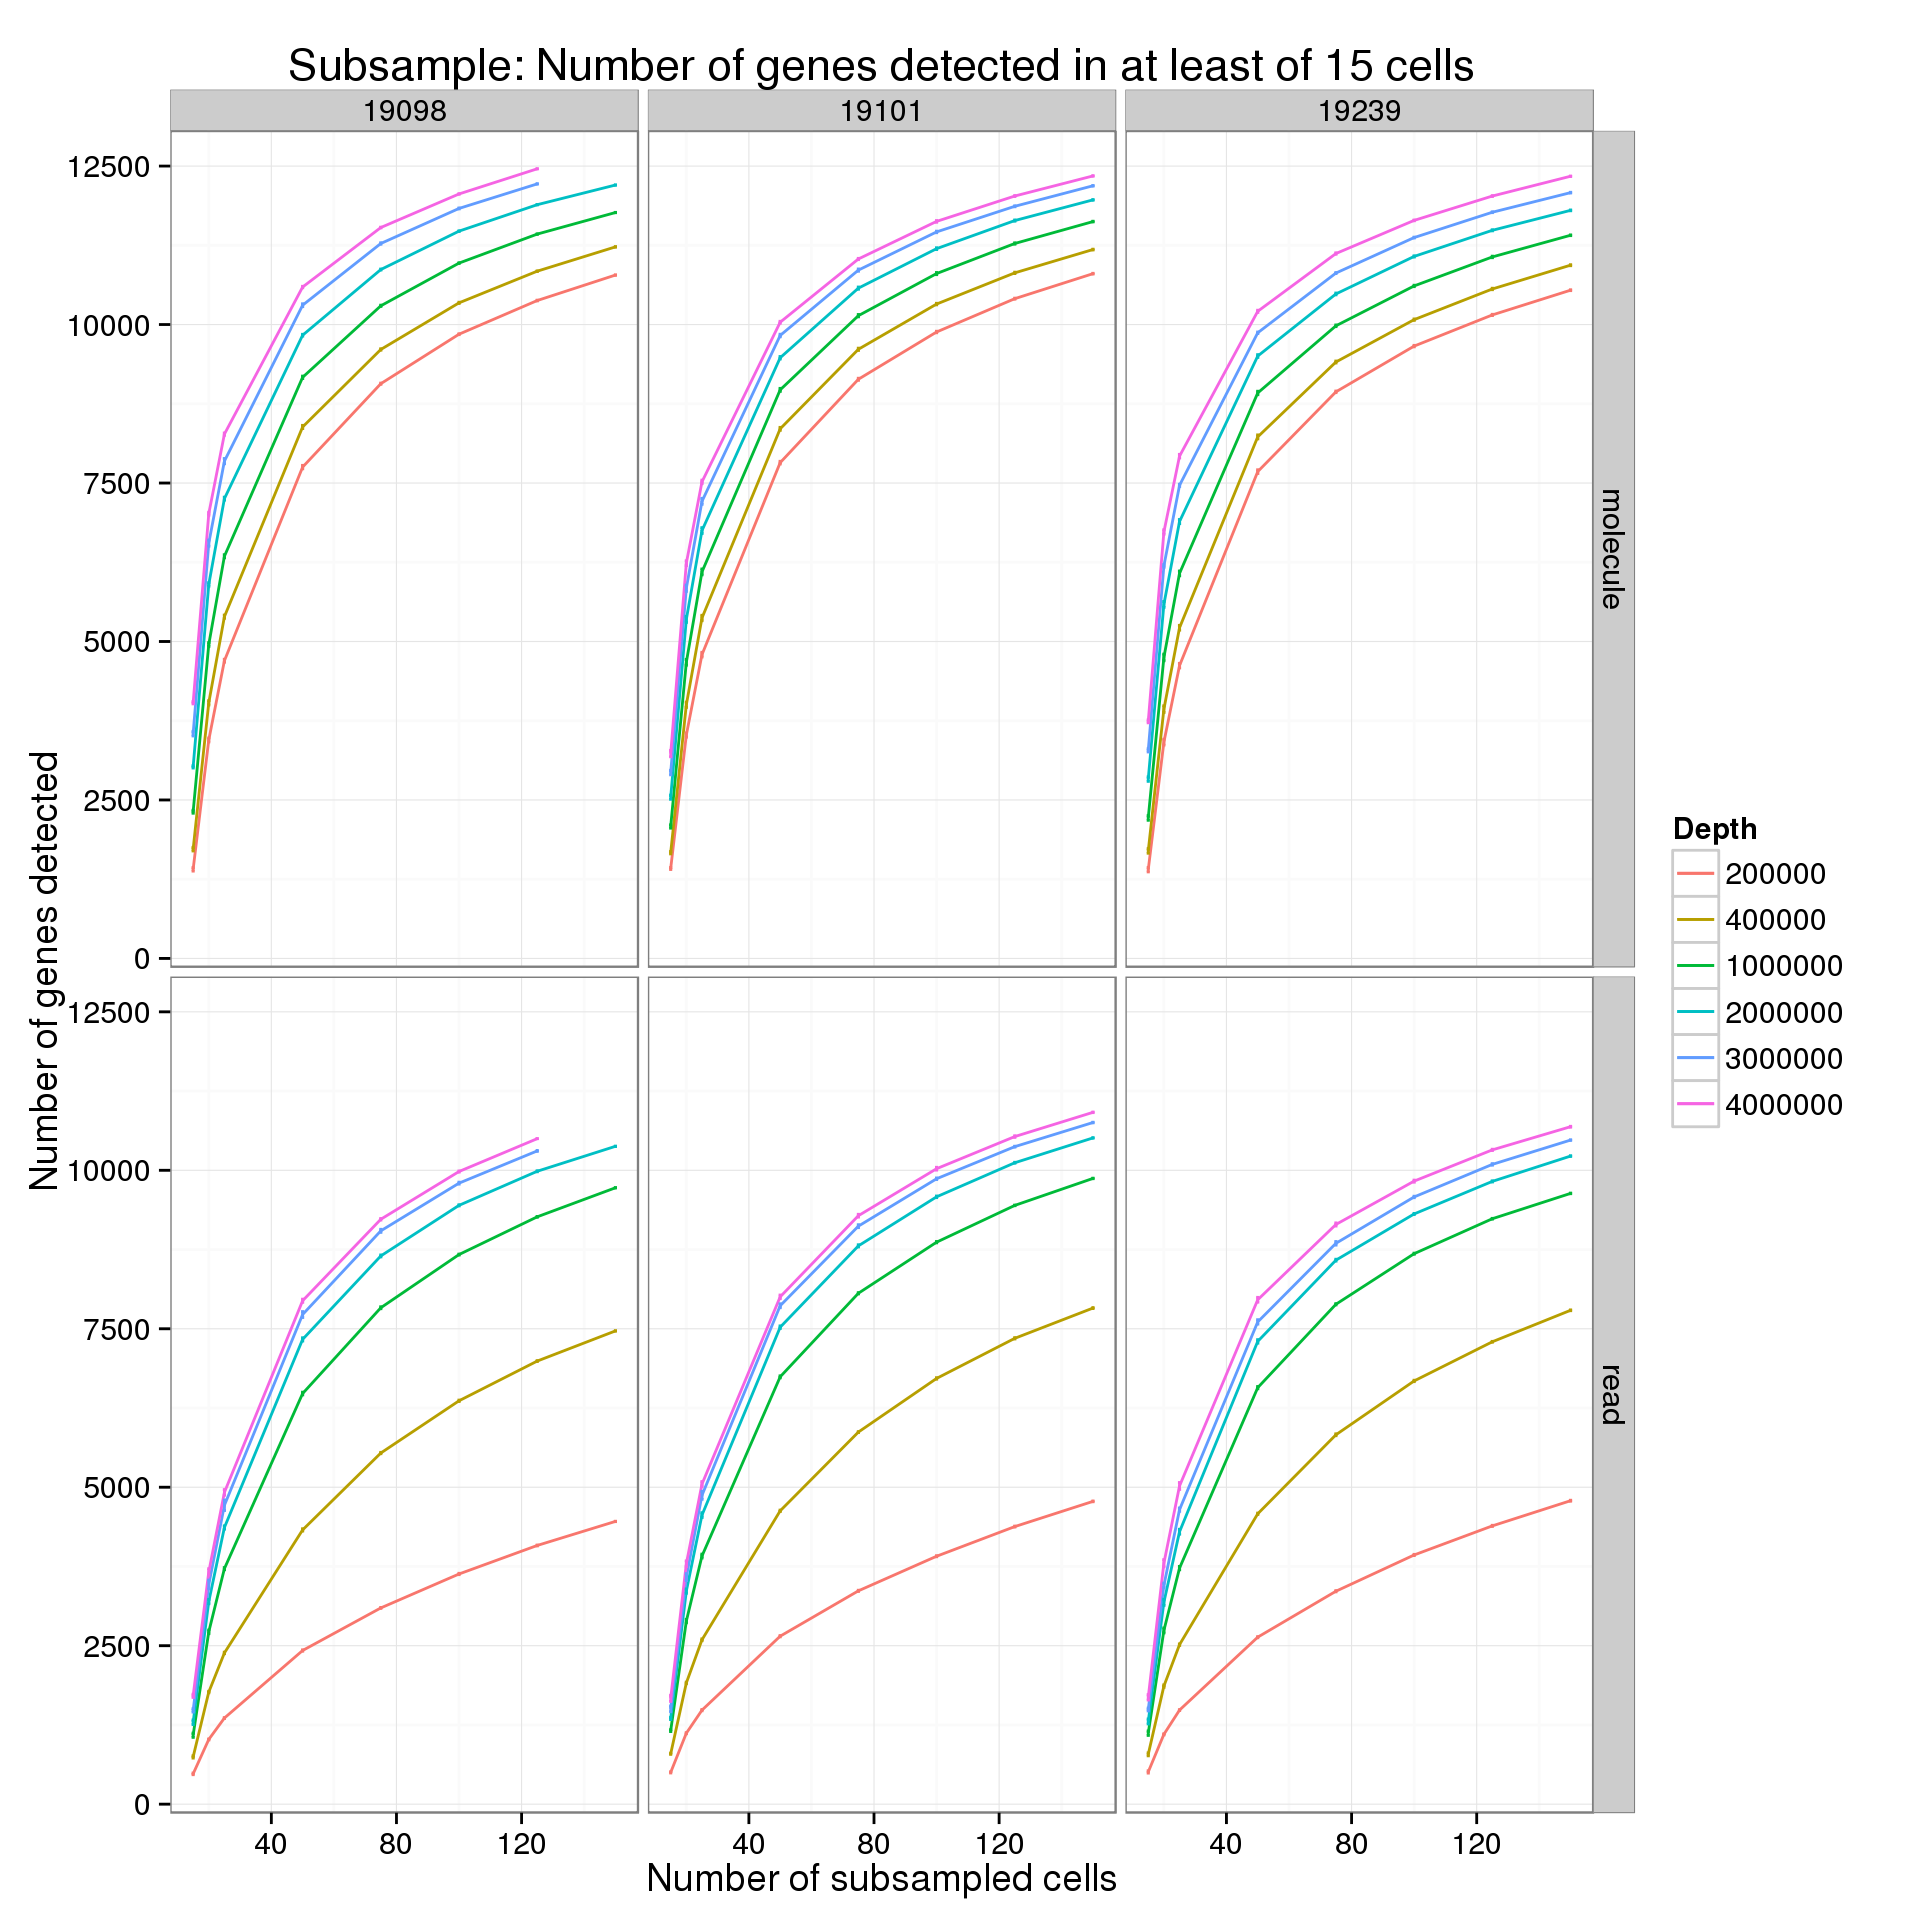
Wu et al. 2014
Wu et al. 2014 observed quickly diminishing returns in the number of genes detected at a threshold of FPKM > 1 after 500,000 reads. In their Figure 5 below, each point represents the mean (+/- standard error) of four random subsamplings of the given sequencing depth. The different lines are for different single cell technologies.

Mean number of total counts
Explore the effect of subsampling sequencing depth and number of cells on the mean total count. Only includes counts of genes which had the minumum count (10 reads; 1 molecule) in the minimum number of cells (5).
Calculate the mean and standard error of the mean (sem) for each of the 10 iterations.
mean_counts_data_plot <- genes_data %>%
  group_by(type, ind, min_cells, depth, num_cells) %>%
  summarize(mean = mean(mean_counts), sem = sd(mean_counts) / sqrt(length(mean_counts)))
p %+% mean_counts_data_plot[mean_counts_data_plot$type == "read" &
mean_counts_data_plot$min_cells == 5, ] +
labs(y = "Mean total count",
title = "Subsample: Mean total count, reads only")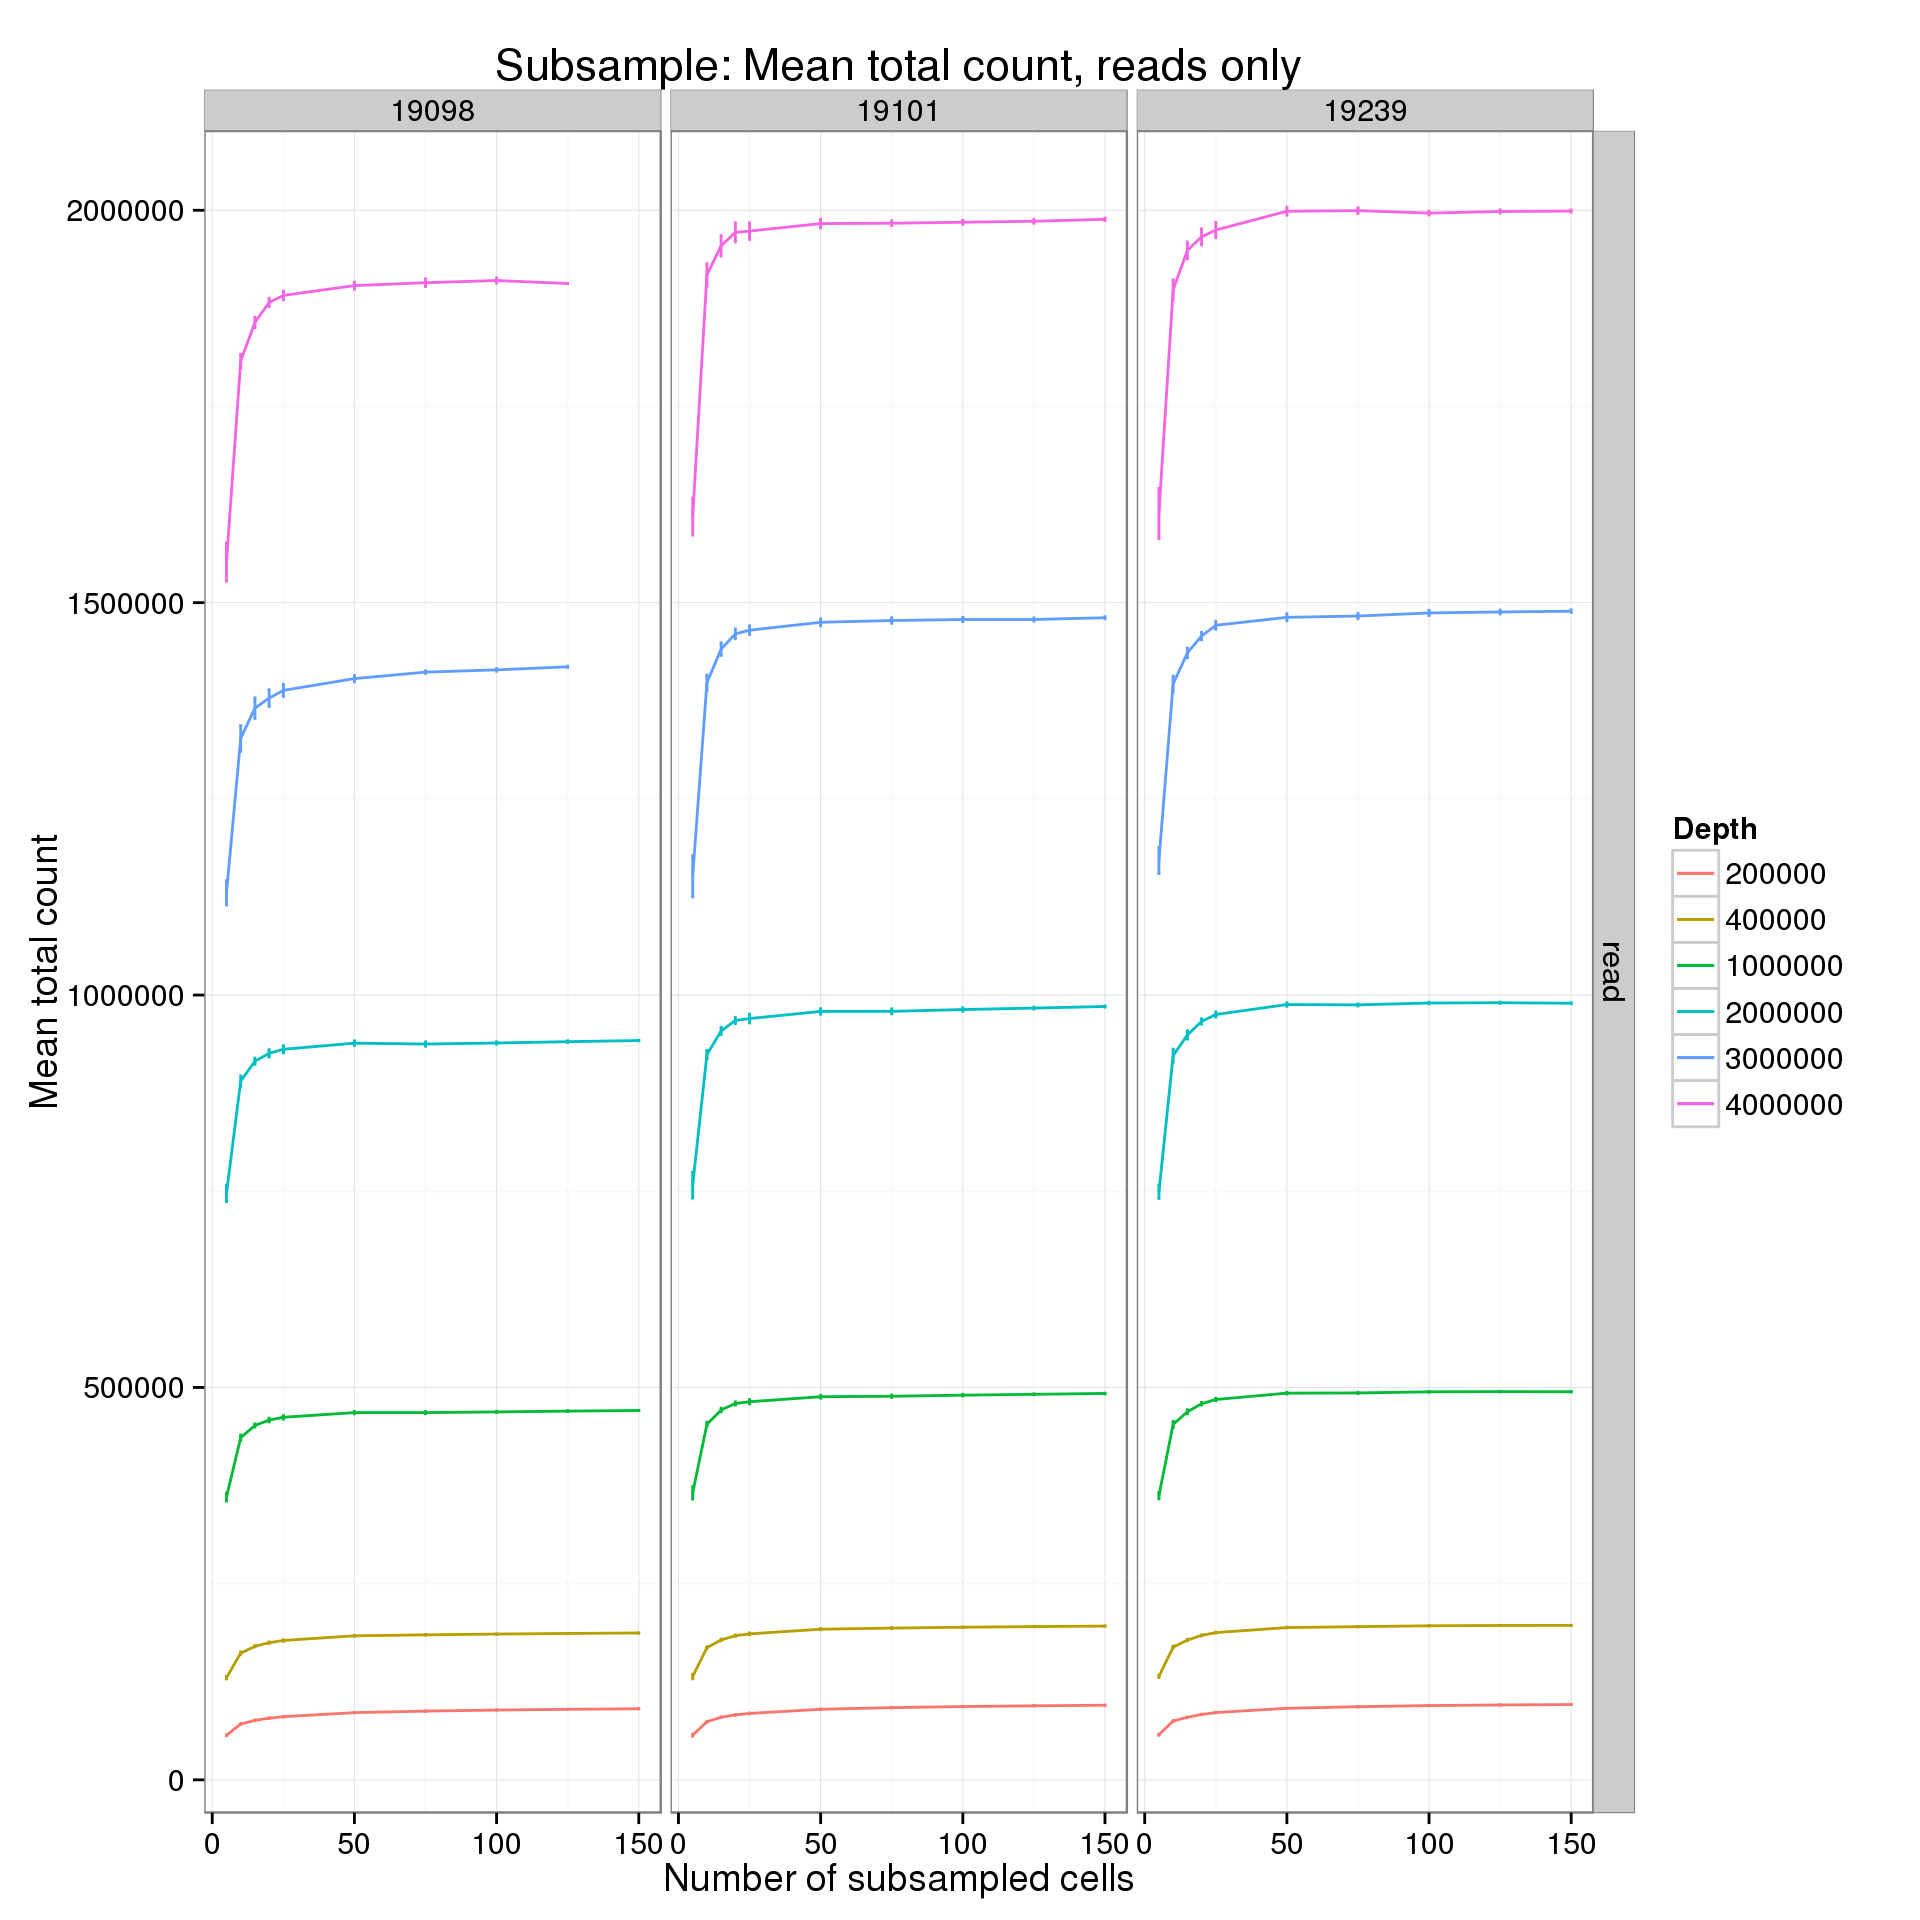
It’s difficult to see the differences in the molecule counts because of the range of the y-axis. Here is the molecule counts alone.
p %+% mean_counts_data_plot[mean_counts_data_plot$type == "molecule" &
                            mean_counts_data_plot$min_cells == 5, ] +
  labs(y = "Mean total count",
       title = "Subsample: Mean total count, molecules only")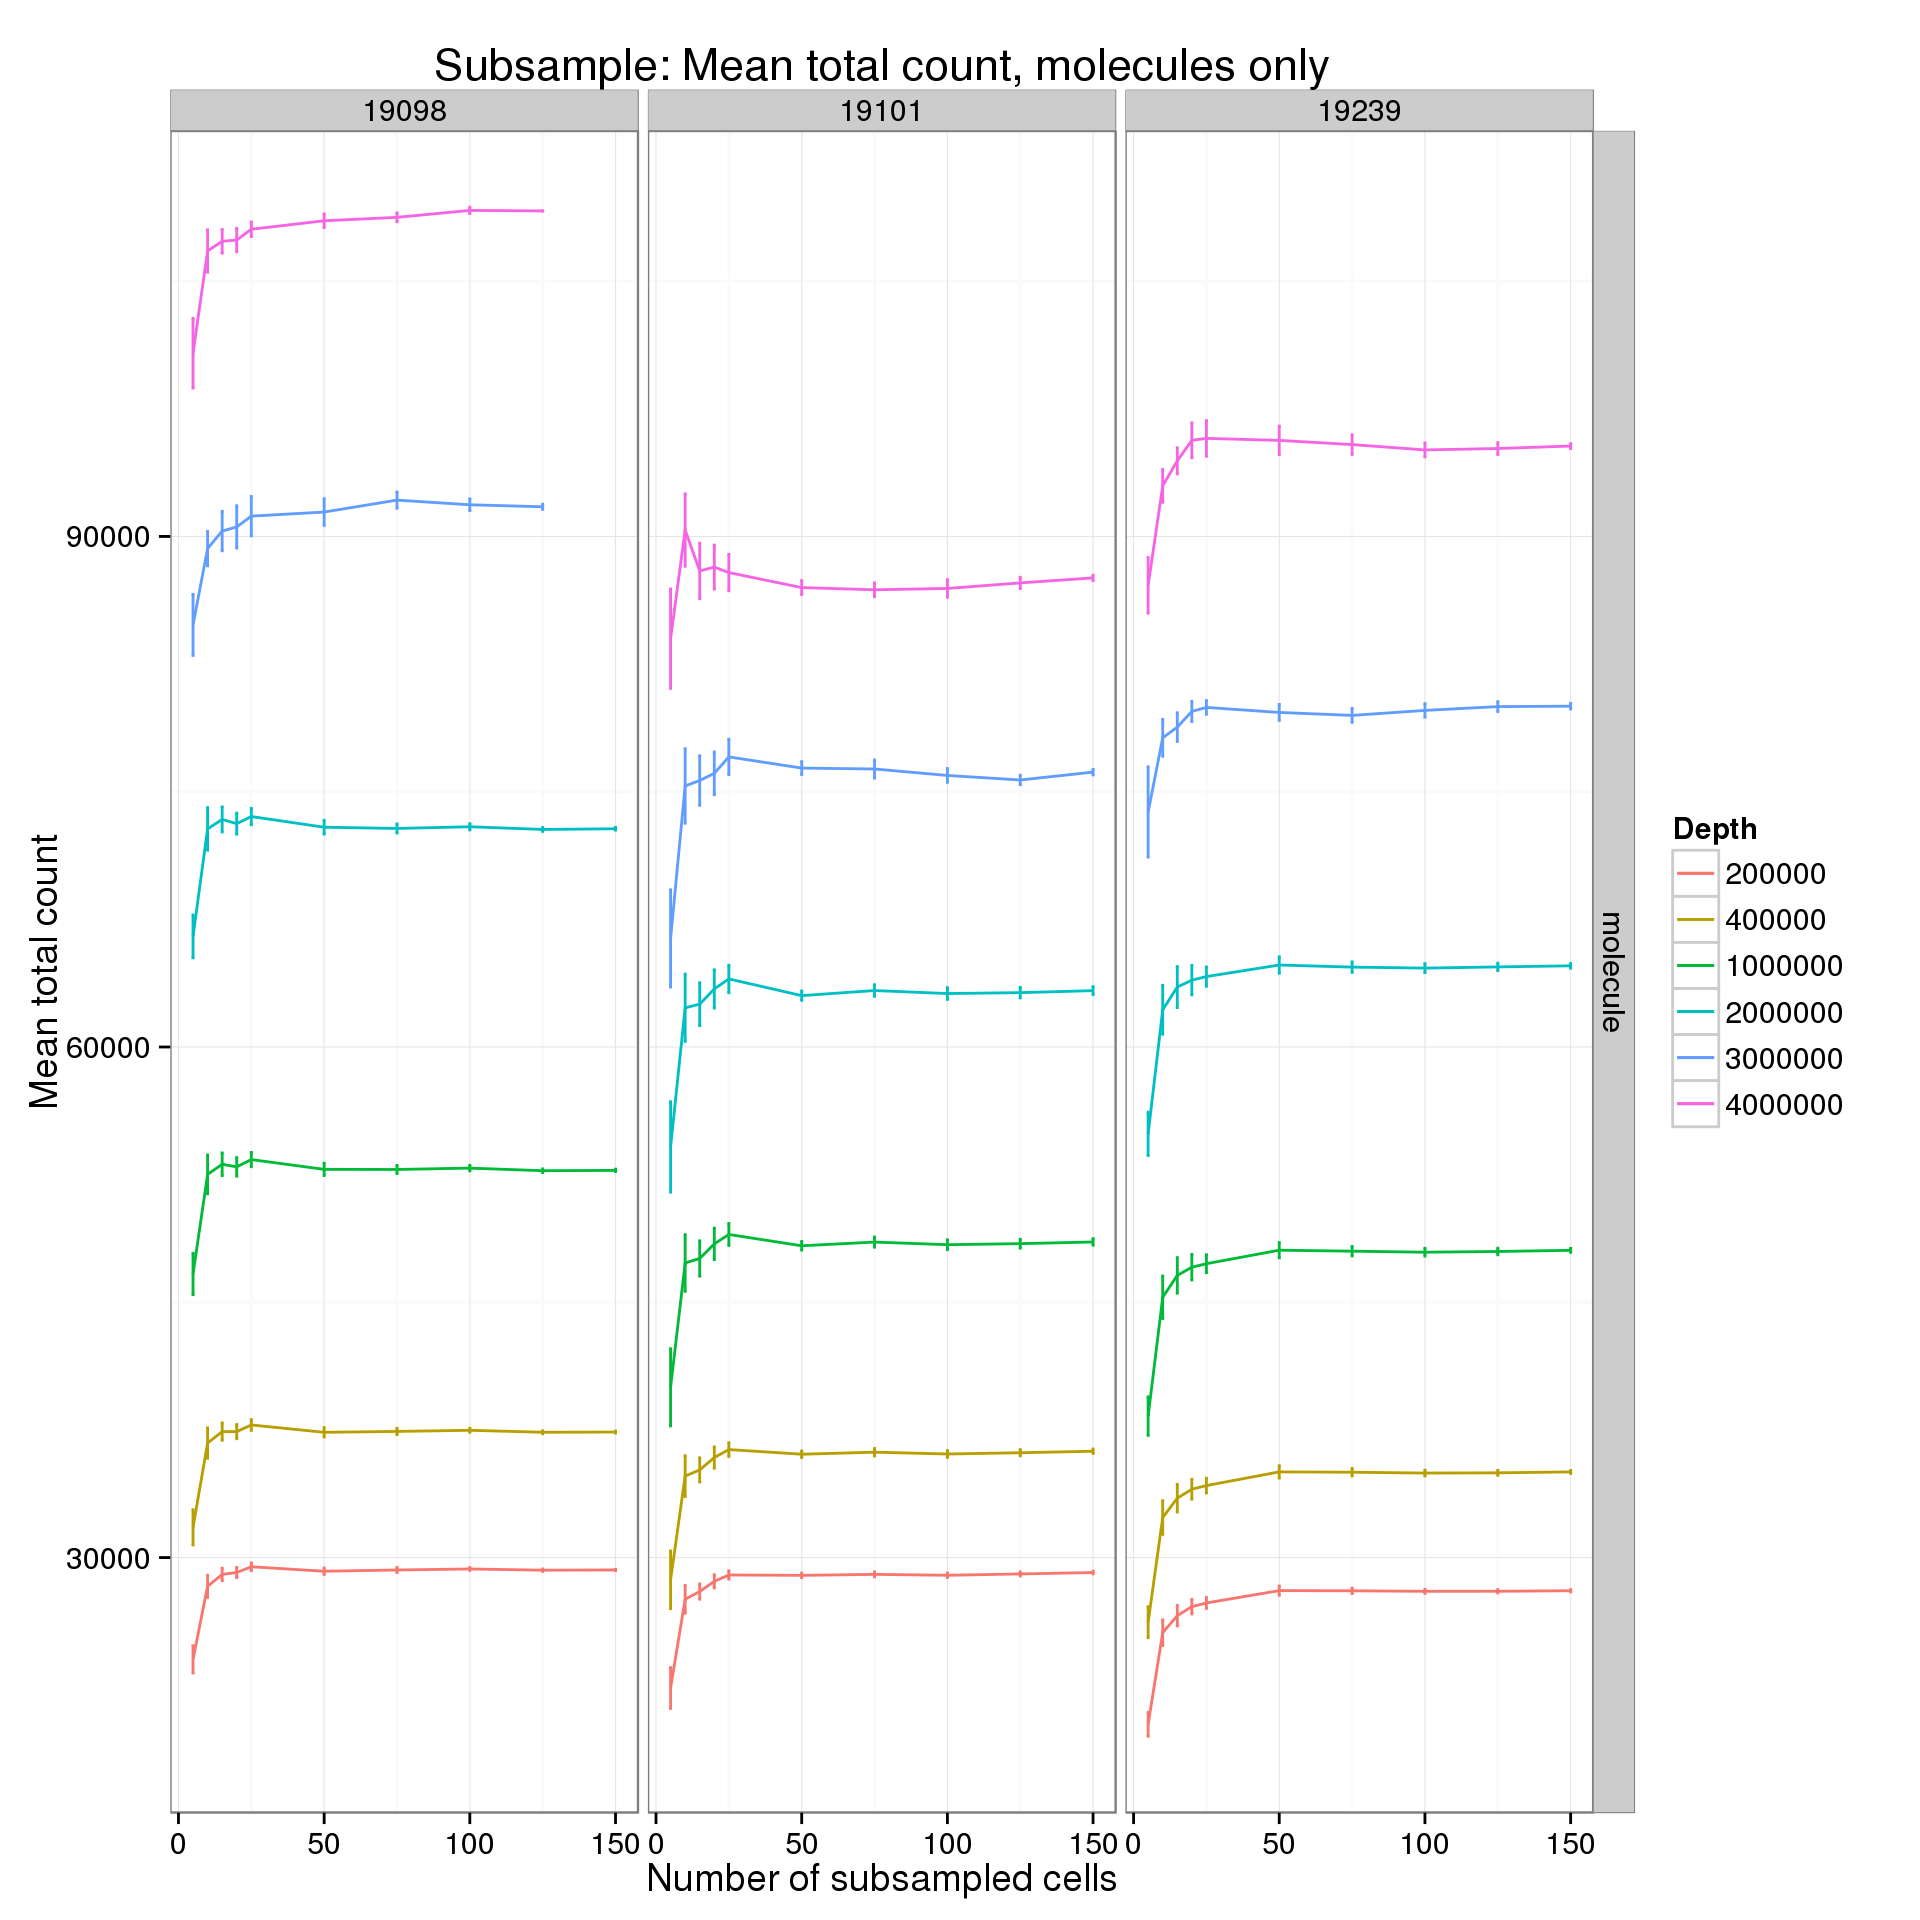
Keeping the number of subsampled cells constant to focus specifically on changes in sequencing depth.
p_box <- ggplot(genes_data[genes_data$type == "molecule" &
                           genes_data$min_cells == 5 &
                           genes_data$num_cells %in% c(25, 75, 125), ],
                aes(x = as.factor(depth), y = mean_counts)) +
  geom_boxplot() +
  facet_grid(num_cells~type) +
  labs(x = "Depth", y = "Mean total count",
       title = "Effect of sequencing depth on mean total molecule count")
p_box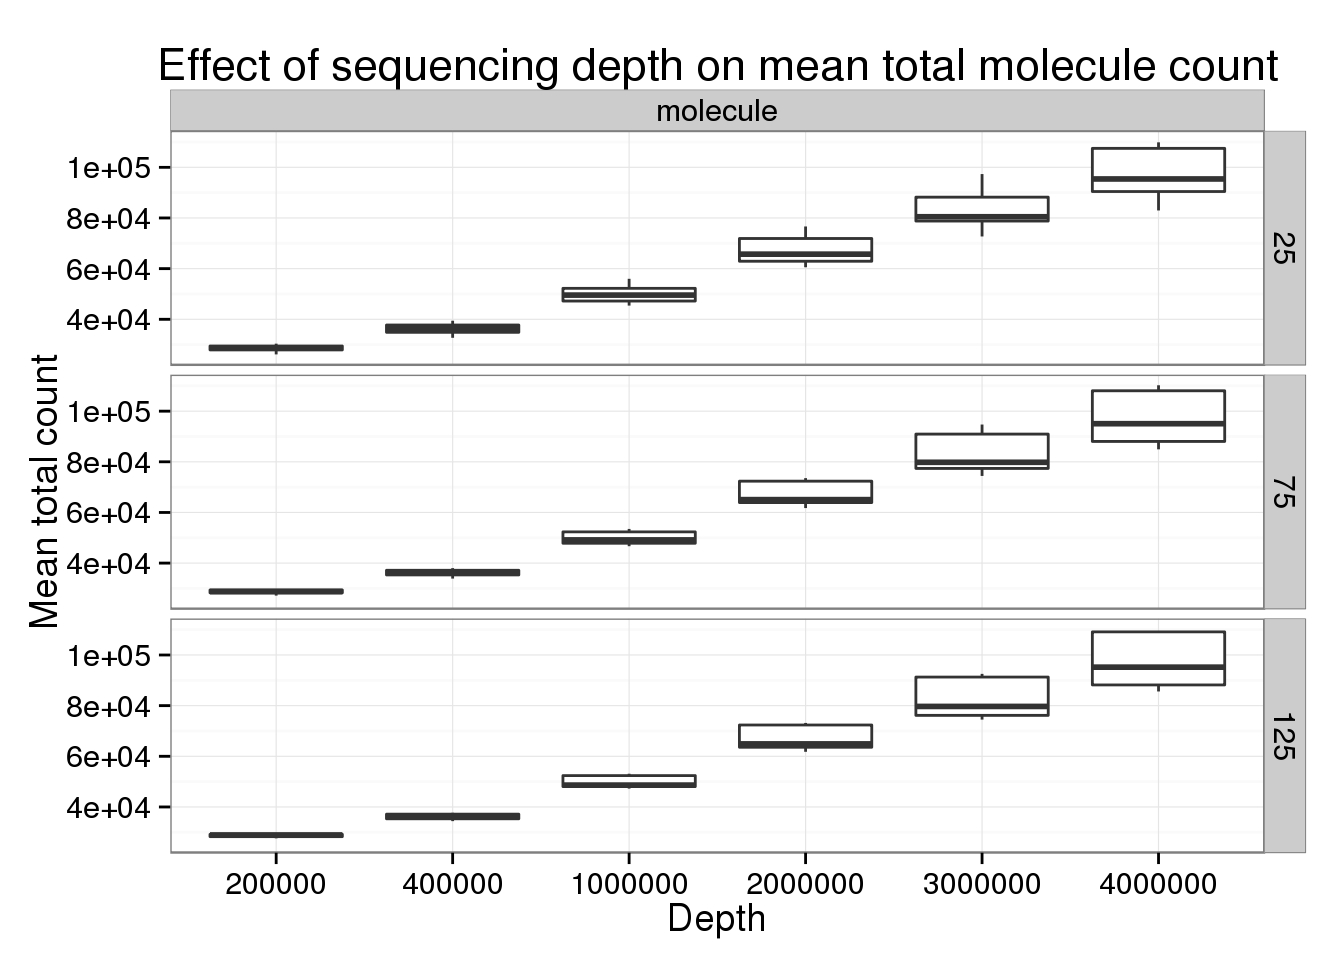
p_box %+% genes_data[genes_data$type == "read" &
                     genes_data$min_cells == 5 &
                     genes_data$num_cells %in% c(25, 75, 125), ] +
  labs(title = "Effect of sequencing depth on mean total read count")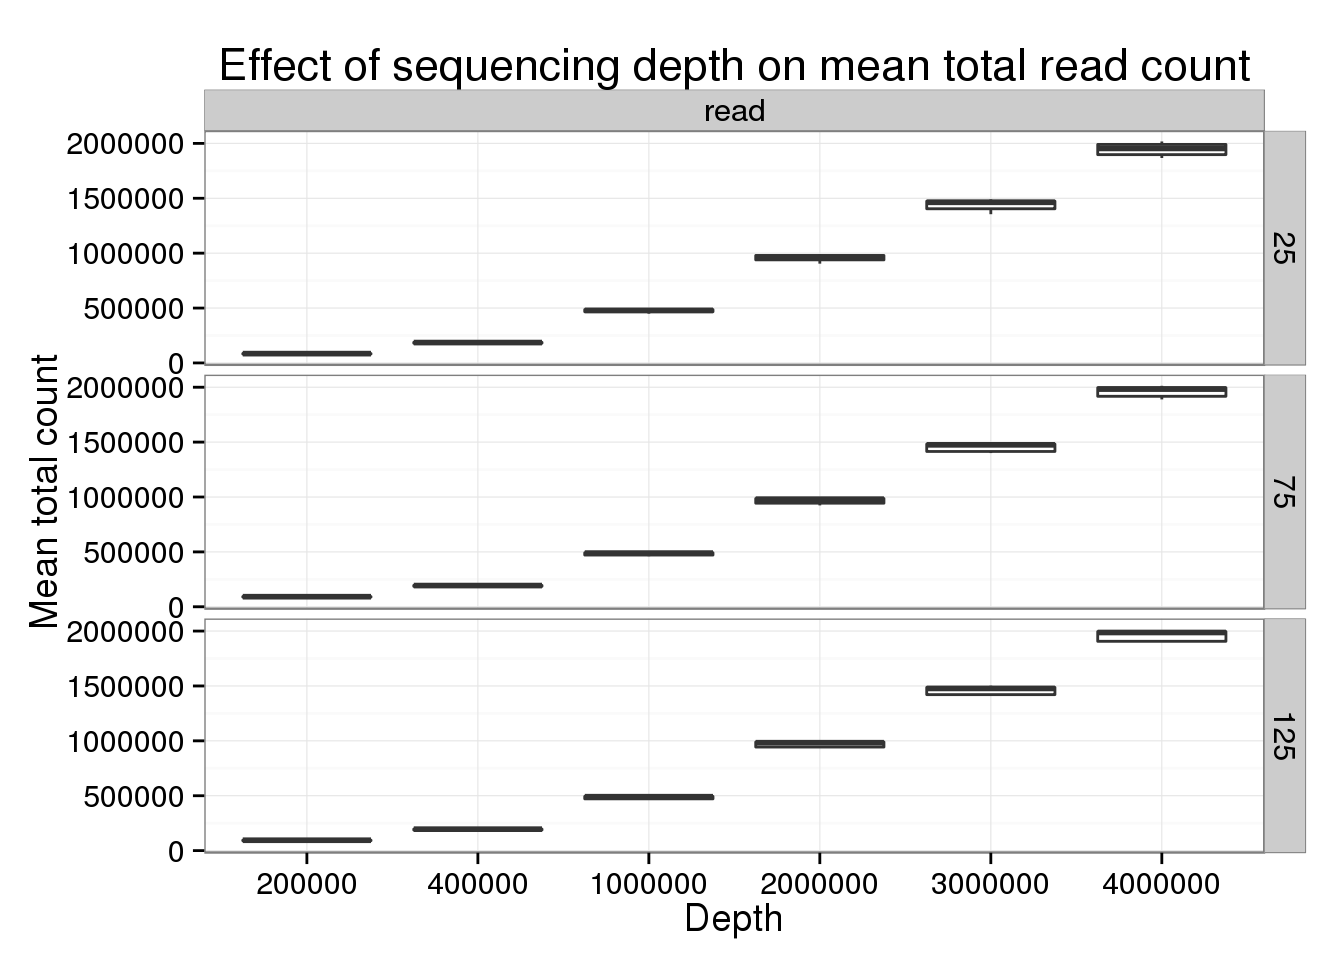
Session information
sessionInfo()R version 3.2.0 (2015-04-16)
Platform: x86_64-unknown-linux-gnu (64-bit)
locale:
[1] LC_CTYPE=en_US.UTF-8 LC_NUMERIC=C
[3] LC_TIME=en_US.UTF-8 LC_COLLATE=en_US.UTF-8
[5] LC_MONETARY=en_US.UTF-8 LC_MESSAGES=en_US.UTF-8
[7] LC_PAPER=en_US.UTF-8 LC_NAME=C
[9] LC_ADDRESS=C LC_TELEPHONE=C
[11] LC_MEASUREMENT=en_US.UTF-8 LC_IDENTIFICATION=C
attached base packages:
[1] stats graphics grDevices utils datasets methods base
other attached packages:
[1] ggplot2_1.0.1 dplyr_0.4.1 knitr_1.10.5
loaded via a namespace (and not attached):
[1] Rcpp_0.11.6 magrittr_1.5 MASS_7.3-40 munsell_0.4.2
[5] colorspace_1.2-6 stringr_1.0.0 plyr_1.8.2 tools_3.2.0
[9] parallel_3.2.0 grid_3.2.0 gtable_0.1.2 DBI_0.3.1
[13] htmltools_0.2.6 yaml_2.1.13 lazyeval_0.1.10 assertthat_0.1
[17] digest_0.6.8 reshape2_1.4.1 formatR_1.2 evaluate_0.7
[21] rmarkdown_0.6.1 labeling_0.3 stringi_0.4-1 scales_0.2.4
[25] proto_0.3-10