Proportion of genes detected after filtering
2016-02-05
Last updated: 2016-02-16
Code version: 19e0b5238d17b956c12a2c43d67bdc024117580c
source("functions.R")
library("edgeR")
library("tidyr")
library("ggplot2")
library("cowplot")
theme_set(theme_bw(base_size = 16))
theme_update(panel.grid.minor.x = element_blank(),
             panel.grid.minor.y = element_blank(),
             panel.grid.major.x = element_blank(),
             panel.grid.major.y = element_blank())
Hicks et al., 2015 observed a strong relationship between the proportion of genes detected (PGD) per sample and PC1 across multiple single cell studies. Here we investigate this effect in our study. Specifcally, we explore the following questions:
- How much is the PGD effect driven by lowly expressed genes?
- Does our normalization procedure reduce the effect of the PGD?
- Is there a difference in PGD between reads and molecules?
- What effect does the pseudocount have on the PGD effect?
Input
Input annotation
anno <- read.table("../data/annotation.txt", header = TRUE,
                   stringsAsFactors = FALSE)

anno_filter <- read.table("../data/annotation-filter.txt", header = TRUE,
                   stringsAsFactors = FALSE)
Input molecule counts
molecules <- read.table("../data/molecules.txt", header = TRUE,
           stringsAsFactors = FALSE)

molecules_filter <- read.table("../data/molecules-filter.txt", header = TRUE,
           stringsAsFactors = FALSE)

molecules_final <- read.table("../data/molecules-final.txt", header = TRUE,
           stringsAsFactors = FALSE)
Input read counts
reads <- read.table("../data/reads.txt", header = TRUE,
                    stringsAsFactors = FALSE)

reads_filter <- read.table("../data/reads-filter.txt", header = TRUE,
                    stringsAsFactors = FALSE)
Prepare data
We want to explore the effect of filtering lowly expressed genes. reads and molecules include all the genes with at least one read observed across all the single cells, including the low quality cells. Thus in order to isolate the effect of lowly expressed genes, we first need to remove the low quality cells.
molecules_qc <- molecules[, colnames(molecules_filter)]
reads_qc <- reads[, colnames(reads_filter)]
stopifnot(anno_filter$sample_id == colnames(molecules_qc),
          anno_filter$sample_id == colnames(reads_qc))
However, some genes have zero counts across only the quality single cells. Thus we remove these.
zero_genes <- rowSums(molecules_qc) == 0
molecules_qc <- molecules_qc[!zero_genes, ]
reads_qc <- reads_qc[!zero_genes, ]
stopifnot(rownames(molecules_qc) == rownames(reads_qc))
Lastly, we include a subset of ubiquitous genes which were detected in every cell, i.e. the PGD will be 1 for all samples.
ubiquitous_genes <- rowSums(molecules_qc > 0) == ncol(molecules_qc)
molecules_ubiq <- molecules_qc[ubiquitous_genes, ]
reads_ubiq <- reads_qc[ubiquitous_genes, ]
Calculate PGD
Define a function to calculate PGD.
calc_pgd <- function(x) {
  # Calculate the proportion of genes detected (PGD) per sample/column
  #
  # x - gene expression counts
  #
  # Returns a numeric vector
  stopifnot(!is.null(dim(x)),
            x == as.integer(as.matrix(x)))
  num_genes_detected <- colSums(x > 0)
  num_total_genes <- nrow(x)
  prop_genes_detected <- num_genes_detected / num_total_genes
  stopifnot(is.numeric(prop_genes_detected),
            length(prop_genes_detected) == ncol(x),
            prop_genes_detected <= 1,
            prop_genes_detected >= 0)
  return(prop_genes_detected)
}
Calculate the PGD using all genes with at least one read detected in at least one single cell.
pgd_all <- calc_pgd(reads_qc)
# pgd_filter <- calc_pgd(reads_filter)
# pgd_ubiq <- calc_pgd(reads_ubiq)
# stopifnot(pgd_ubiq == 1)
# stopifnot(pgd_all == calc_pgd(molecules_qc))
PCA - counts
Unstandardized read counts from all genes with at least one observed read.
pca <- run_pca(reads_qc)
d <- data.frame(id = rownames(pca$PCs), pca$PCs[, 1:2],
                explained = pca$explained, pgd = pgd_all,
                type = "reads", genes = "all", processing = "counts")
d_full <- d
Unstandardized molecule counts from all genes with at least one observed read.
pca <- run_pca(molecules_qc)
d <- data.frame(id = rownames(pca$PCs), pca$PCs[, 1:2],
                explained = pca$explained, pgd = pgd_all,
                type = "molecules", genes = "all", processing = "counts")
d_full <- rbind(d_full, d)
Unstandardized read counts from set of filtered genes.
pca <- run_pca(reads_filter)
d <- data.frame(id = rownames(pca$PCs), pca$PCs[, 1:2],
                explained = pca$explained, pgd = pgd_all,
                type = "reads", genes = "filter", processing = "counts")
d_full <- rbind(d_full, d)
Unstandardized molecule counts from set of filtered genes.
pca <- run_pca(molecules_filter)
d <- data.frame(id = rownames(pca$PCs), pca$PCs[, 1:2],
                explained = pca$explained, pgd = pgd_all,
                type = "molecules", genes = "filter", processing = "counts")
d_full <- rbind(d_full, d)
Unstandardized read counts from set of ubiquitous genes.
pca <- run_pca(reads_ubiq)
d <- data.frame(id = rownames(pca$PCs), pca$PCs[, 1:2],
                explained = pca$explained, pgd = pgd_all,
                type = "reads", genes = "ubiq", processing = "counts")
d_full <- rbind(d_full, d)
Unstandardized molecule counts from set of ubiquitous genes.
pca <- run_pca(molecules_ubiq)
d <- data.frame(id = rownames(pca$PCs), pca$PCs[, 1:2],
                explained = pca$explained, pgd = pgd_all,
                type = "molecules", genes = "ubiq", processing = "counts")
d_full <- rbind(d_full, d)
PCA - cpm
Read counts per million from all genes with at least one observed read.
pca <- run_pca(cpm(reads_qc))
d <- data.frame(id = rownames(pca$PCs), pca$PCs[, 1:2],
                explained = pca$explained, pgd = pgd_all,
                type = "reads", genes = "all", processing = "cpm")
d_full <- rbind(d_full, d)
Molecule counts per million from all genes with at least one observed read.
pca <- run_pca(cpm(molecules_qc))
d <- data.frame(id = rownames(pca$PCs), pca$PCs[, 1:2],
                explained = pca$explained, pgd = pgd_all,
                type = "molecules", genes = "all", processing = "cpm")
d_full <- rbind(d_full, d)
Read counts per million from set of filtered genes.
pca <- run_pca(cpm(reads_filter))
d <- data.frame(id = rownames(pca$PCs), pca$PCs[, 1:2],
                explained = pca$explained, pgd = pgd_all,
                type = "reads", genes = "filter", processing = "cpm")
d_full <- rbind(d_full, d)
Molecule counts per million from set of filtered genes.
pca <- run_pca(cpm(molecules_filter))
d <- data.frame(id = rownames(pca$PCs), pca$PCs[, 1:2],
                explained = pca$explained, pgd = pgd_all,
                type = "molecules", genes = "filter", processing = "cpm")
d_full <- rbind(d_full, d)
Read counts per million from set of ubiquitous genes.
pca <- run_pca(cpm(reads_ubiq))
d <- data.frame(id = rownames(pca$PCs), pca$PCs[, 1:2],
                explained = pca$explained, pgd = pgd_all,
                type = "reads", genes = "ubiq", processing = "cpm")
d_full <- rbind(d_full, d)
Molecule counts per million from set of ubiquitous genes.
pca <- run_pca(cpm(molecules_ubiq))
d <- data.frame(id = rownames(pca$PCs), pca$PCs[, 1:2],
                explained = pca$explained, pgd = pgd_all,
                type = "molecules", genes = "ubiq", processing = "cpm")
d_full <- rbind(d_full, d)
PCA - log2 cpm edgeR
Read log2 counts per million (edgeR) from all genes with at least one observed read.
pca <- run_pca(cpm(reads_qc, log = TRUE))
d <- data.frame(id = rownames(pca$PCs), pca$PCs[, 1:2],
                explained = pca$explained, pgd = pgd_all,
                type = "reads", genes = "all", processing = "log2cpm-edgeR")
d_full <- rbind(d_full, d)
Molecule log2 counts per million (edgeR) from all genes with at least one observed read.
pca <- run_pca(cpm(molecules_qc, log = TRUE))
d <- data.frame(id = rownames(pca$PCs), pca$PCs[, 1:2],
                explained = pca$explained, pgd = pgd_all,
                type = "molecules", genes = "all", processing = "log2cpm-edgeR")
d_full <- rbind(d_full, d)
Read log2 counts per million (edgeR) from set of filtered genes.
pca <- run_pca(cpm(reads_filter, log = TRUE))
d <- data.frame(id = rownames(pca$PCs), pca$PCs[, 1:2],
                explained = pca$explained, pgd = pgd_all,
                type = "reads", genes = "filter", processing = "log2cpm-edgeR")
d_full <- rbind(d_full, d)
Molecule log2 counts per million (edgeR) from set of filtered genes.
pca <- run_pca(cpm(molecules_filter, log = TRUE))
d <- data.frame(id = rownames(pca$PCs), pca$PCs[, 1:2],
                explained = pca$explained, pgd = pgd_all,
                type = "molecules", genes = "filter", processing = "log2cpm-edgeR")
d_full <- rbind(d_full, d)
Read log2 counts per million (edgeR) from set of ubiquitous genes.
pca <- run_pca(cpm(reads_ubiq, log = TRUE))
d <- data.frame(id = rownames(pca$PCs), pca$PCs[, 1:2],
                explained = pca$explained, pgd = pgd_all,
                type = "reads", genes = "ubiq", processing = "log2cpm-edgeR")
d_full <- rbind(d_full, d)
Molecule log2 counts per million (edgeR) from set of ubiquitous genes.
pca <- run_pca(cpm(molecules_ubiq, log = TRUE))
d <- data.frame(id = rownames(pca$PCs), pca$PCs[, 1:2],
                explained = pca$explained, pgd = pgd_all,
                type = "molecules", genes = "ubiq", processing = "log2cpm-edgeR")
d_full <- rbind(d_full, d)
PCA - log2 cpm Rafa
Read counts per million from all genes with at least one observed read.
pca <- run_pca(log2(cpm(reads_qc) + 1))
d <- data.frame(id = rownames(pca$PCs), pca$PCs[, 1:2],
                explained = pca$explained, pgd = pgd_all,
                type = "reads", genes = "all", processing = "log2cpm-Rafa")
d_full <- rbind(d_full, d)
Molecule counts per million from all genes with at least one observed read.
pca <- run_pca(log2(cpm(molecules_qc) + 1))
d <- data.frame(id = rownames(pca$PCs), pca$PCs[, 1:2],
                explained = pca$explained, pgd = pgd_all,
                type = "molecules", genes = "all", processing = "log2cpm-Rafa")
d_full <- rbind(d_full, d)
Read counts per million from set of filtered genes.
pca <- run_pca(log2(cpm(reads_filter) + 1))
d <- data.frame(id = rownames(pca$PCs), pca$PCs[, 1:2],
                explained = pca$explained, pgd = pgd_all,
                type = "reads", genes = "filter", processing = "log2cpm-Rafa")
d_full <- rbind(d_full, d)
Molecule counts per million from set of filtered genes.
pca <- run_pca(log2(cpm(molecules_filter) + 1))
d <- data.frame(id = rownames(pca$PCs), pca$PCs[, 1:2],
                explained = pca$explained, pgd = pgd_all,
                type = "molecules", genes = "filter", processing = "log2cpm-Rafa")
d_full <- rbind(d_full, d)
Read counts per million from set of ubiquitous genes.
pca <- run_pca(log2(cpm(reads_ubiq) + 1))
d <- data.frame(id = rownames(pca$PCs), pca$PCs[, 1:2],
                explained = pca$explained, pgd = pgd_all,
                type = "reads", genes = "ubiq", processing = "log2cpm-Rafa")
d_full <- rbind(d_full, d)
Molecule counts per million from set of ubiquitous genes.
pca <- run_pca(log2(cpm(molecules_ubiq) + 1))
d <- data.frame(id = rownames(pca$PCs), pca$PCs[, 1:2],
                explained = pca$explained, pgd = pgd_all,
                type = "molecules", genes = "ubiq", processing = "log2cpm-Rafa")
d_full <- rbind(d_full, d)
Results
For the plots below, the x-axis is always the proportion of genes detected (PGD) that was calculated when considering all genes with at least one read in at least one single cell. PC1 on the y-axis is from the PCA performed on the indicated subset of genes.
d_full <- separate(d_full, col = id, into = c("individual", "replicate", "well"),
                   sep = "\\.")
Effect of processing on reads using all genes:
p_reads_all <- ggplot(d_full[d_full$type == "reads" & d_full$genes == "all", ],
                      aes(x = pgd, y = PC1)) +
  geom_point(aes(color = individual), alpha = 0.5) +
  geom_smooth(method = "lm") +
  facet_wrap(~processing) +
  theme(legend.position = "none")
p_reads_all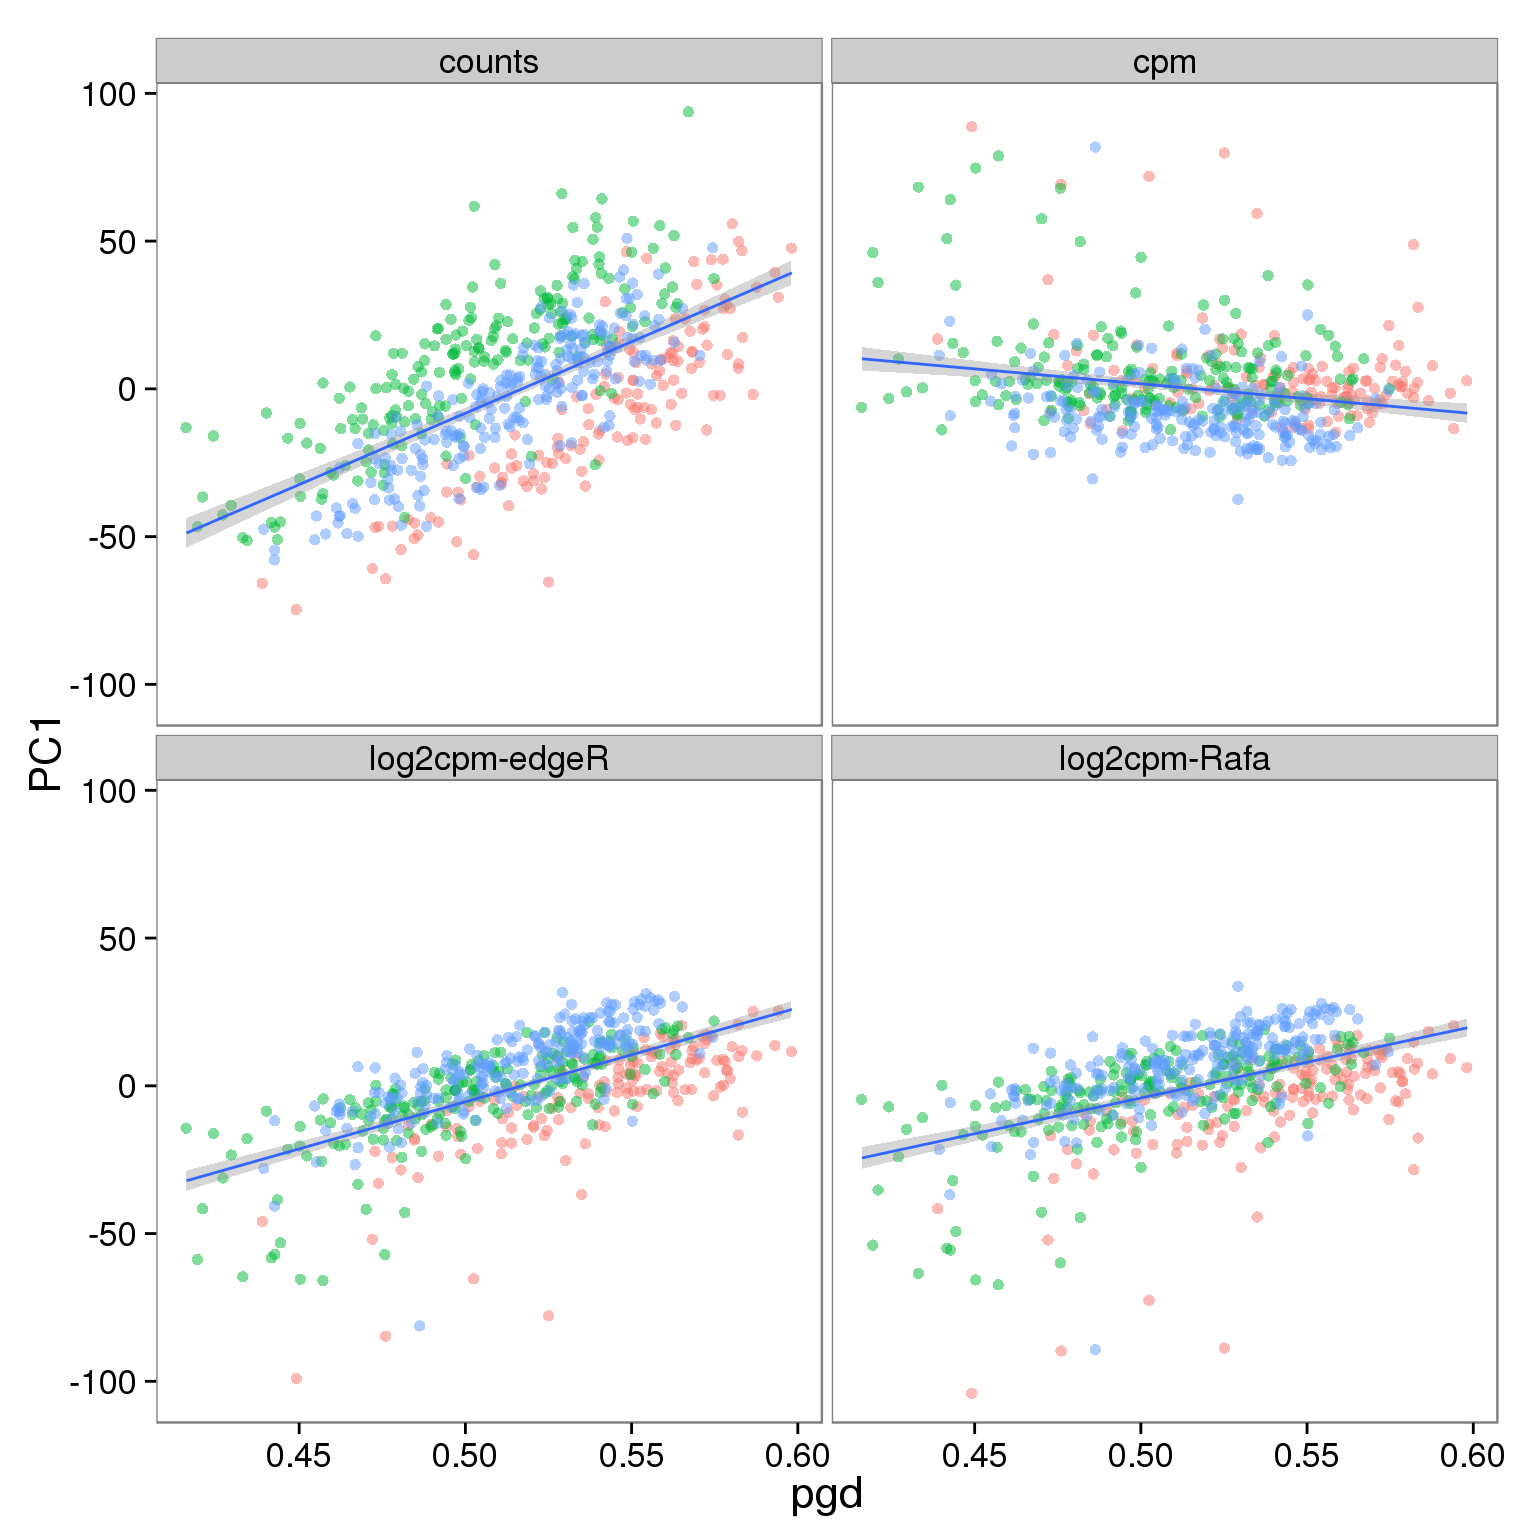
Effect of processing on molecules using all genes:
p_molecules_all <- p_reads_all %+% d_full[d_full$type == "molecules" & d_full$genes == "all", ]
p_molecules_all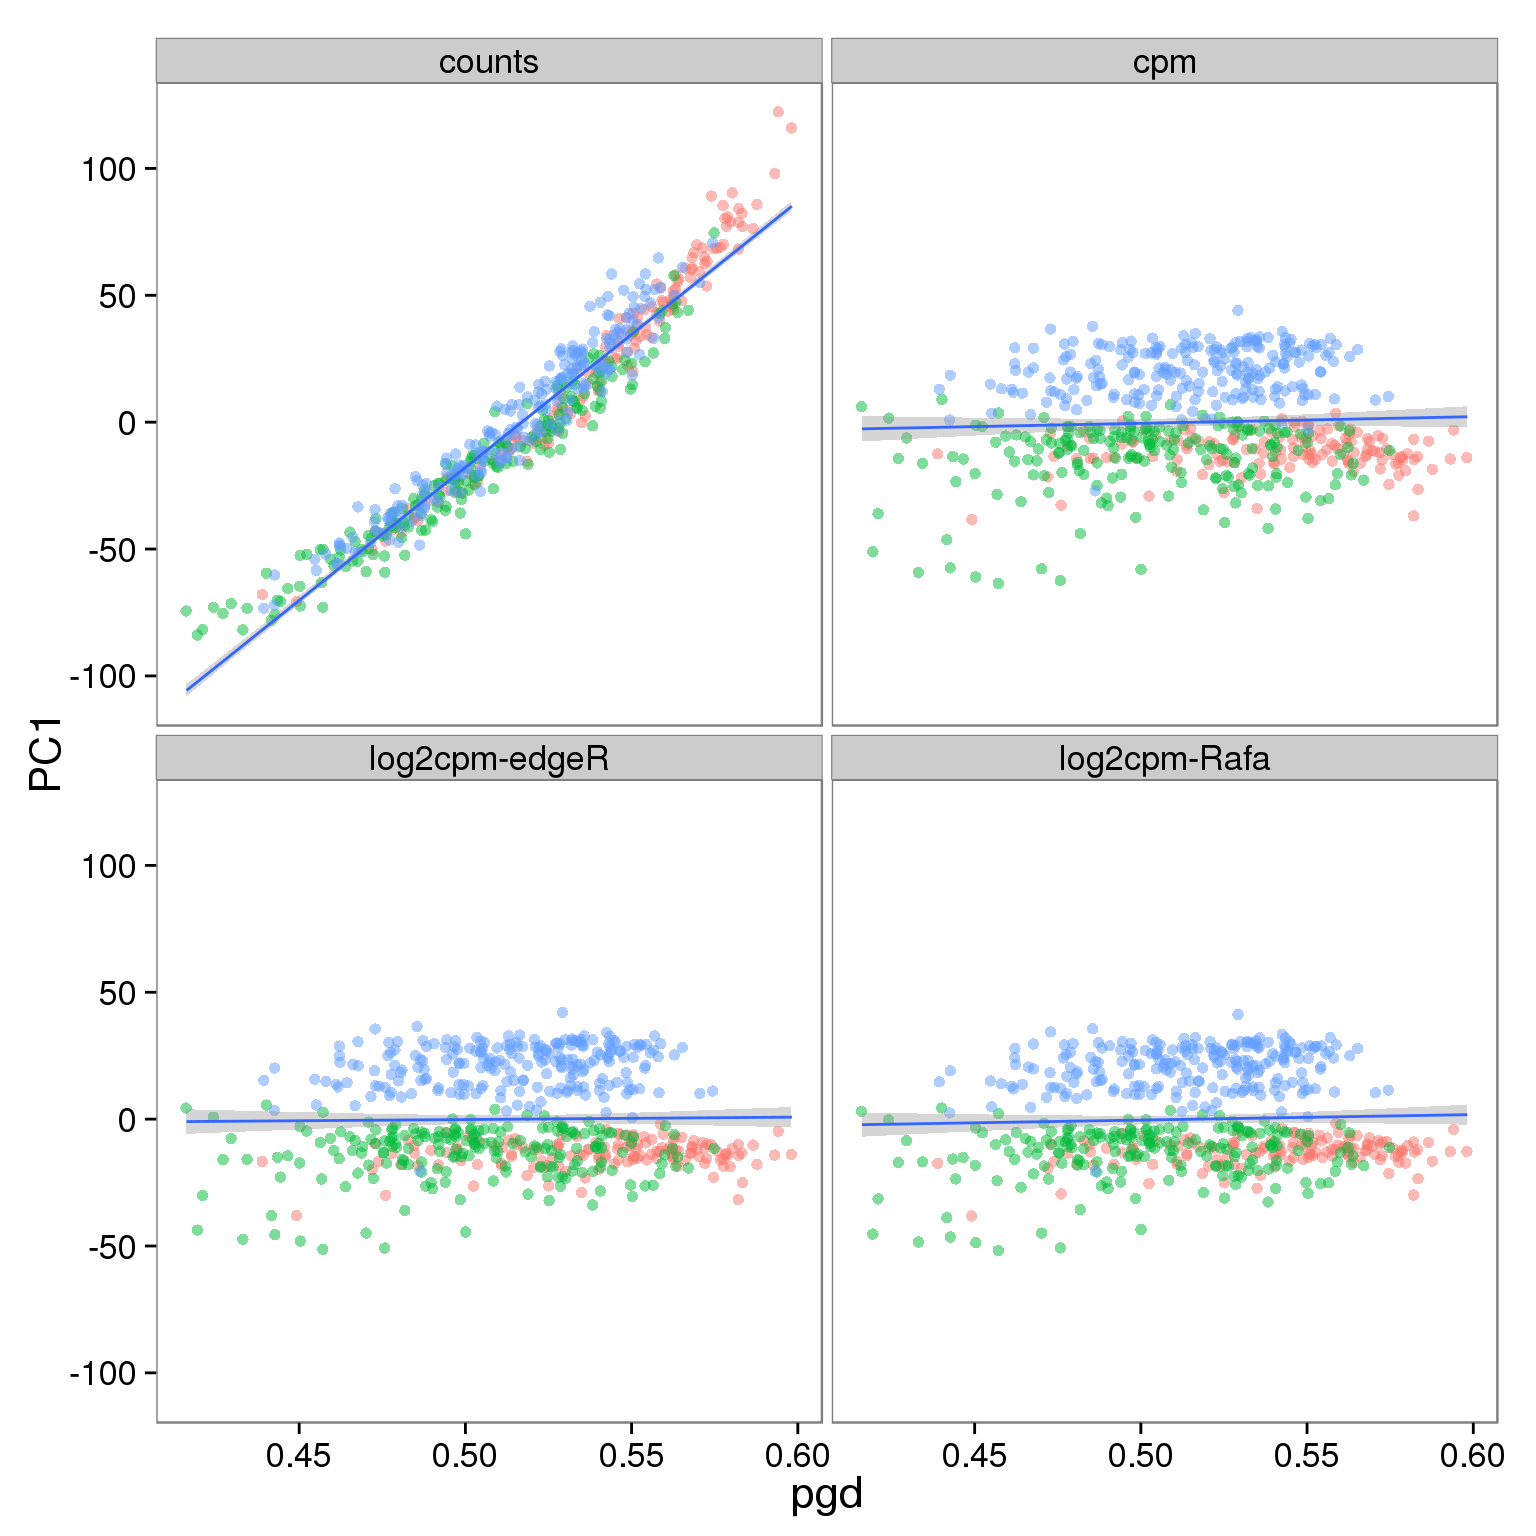
Effect of processing on reads using filtered genes:
p_reads_filter <- p_reads_all %+% d_full[d_full$type == "reads" & d_full$genes == "filter", ]
p_reads_filter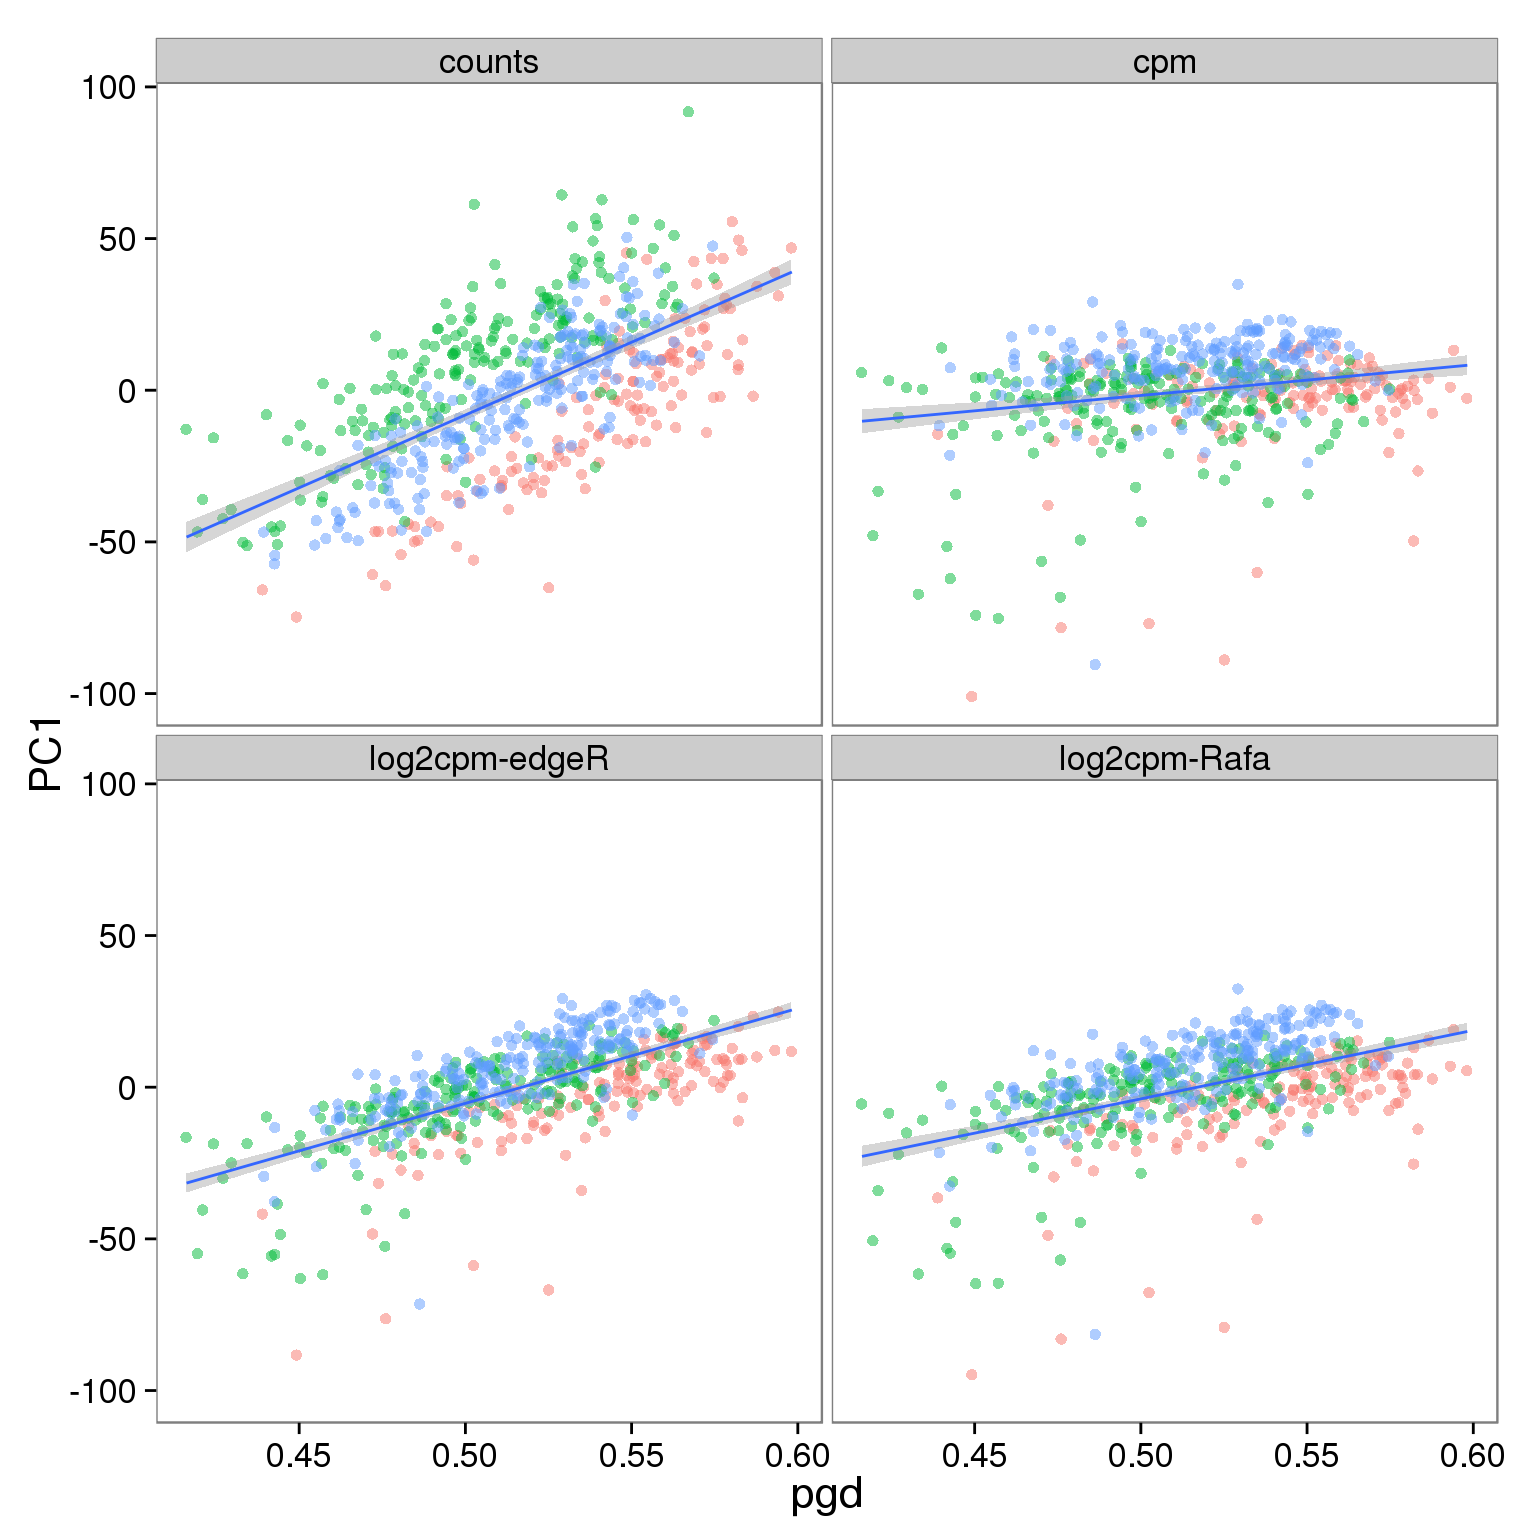
Effect of processing on molecules using filtered genes:
p_molecules_filter <- p_reads_all %+% d_full[d_full$type == "molecules" & d_full$genes == "filter", ]
p_molecules_filter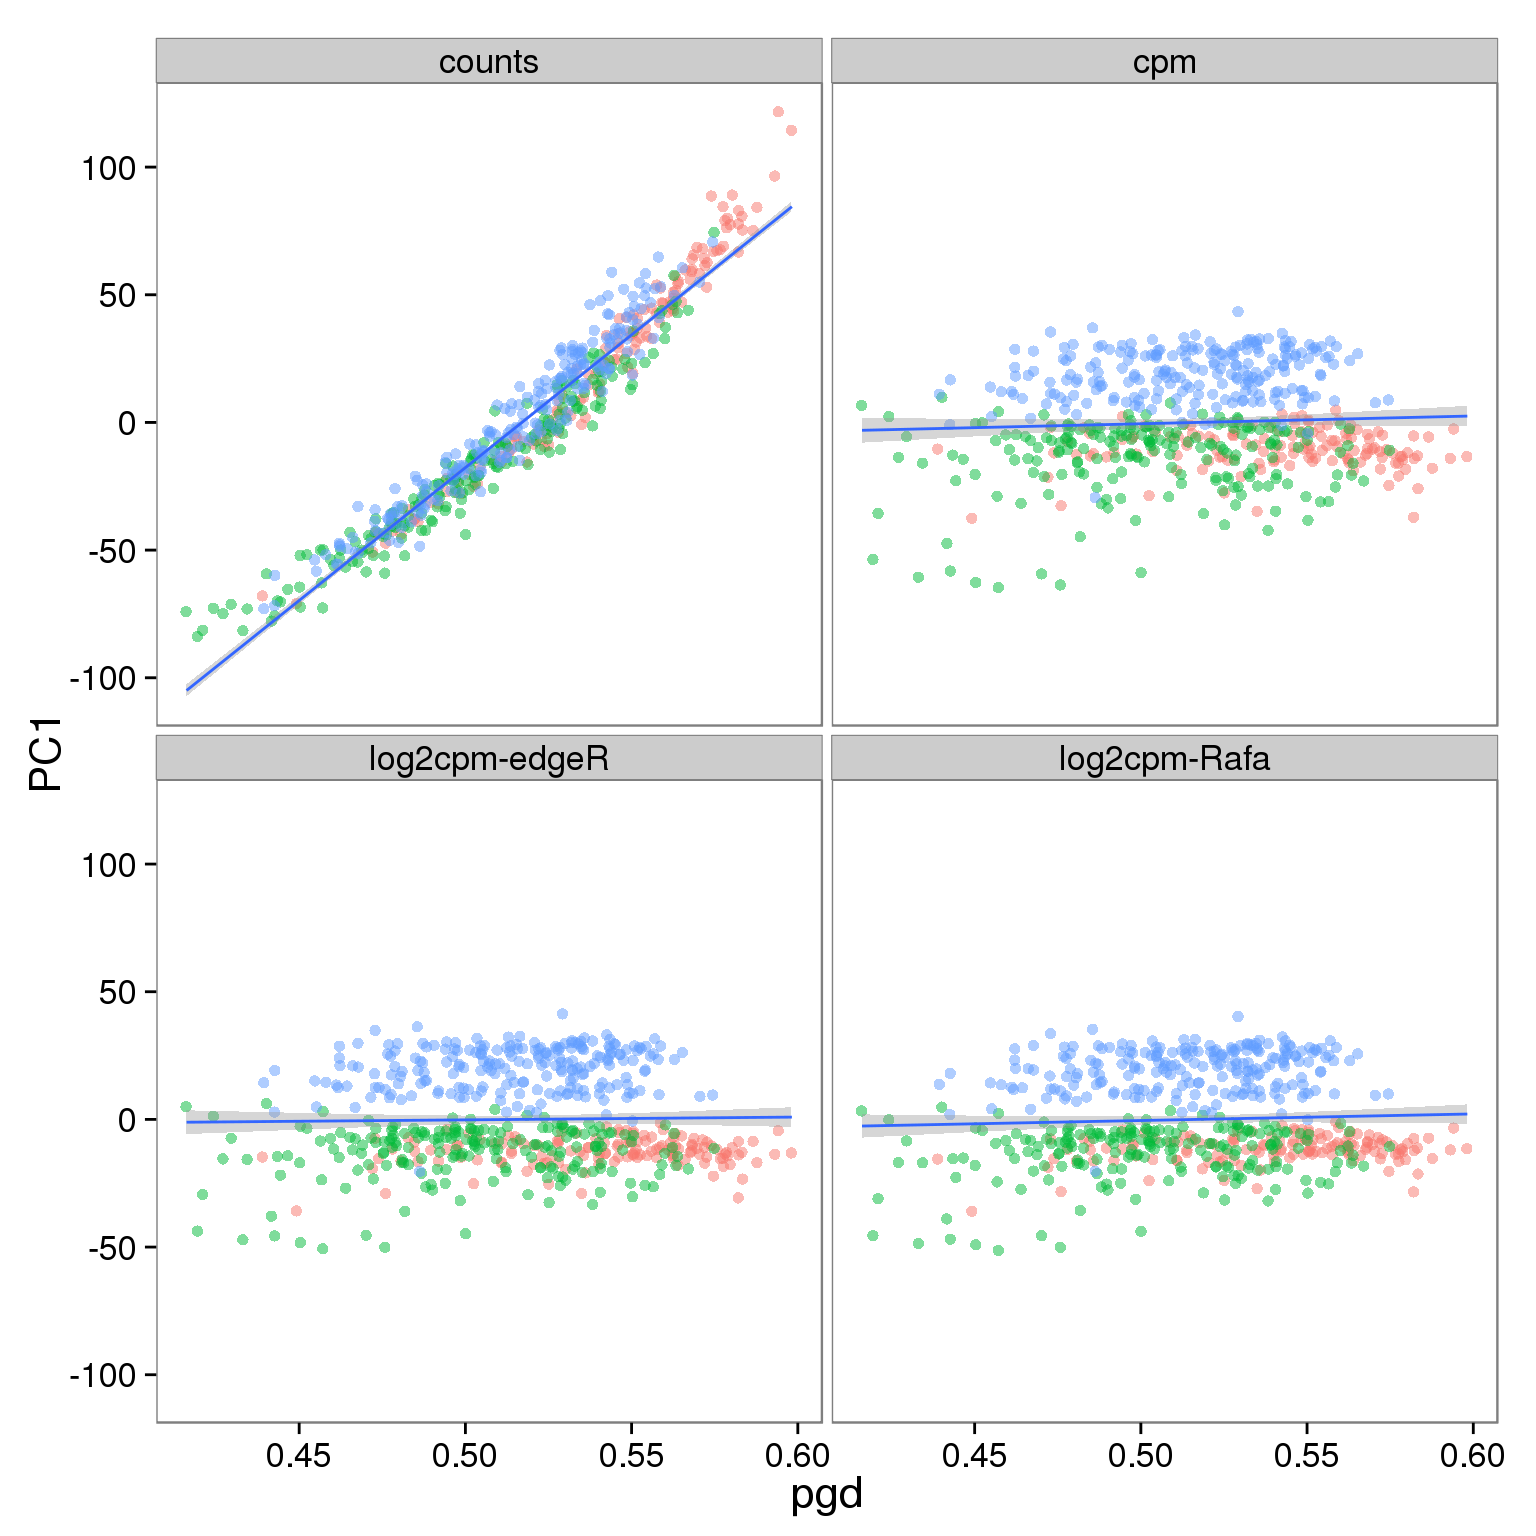
Effect of processing on reads using ubiquitous genes:
p_reads_filter <- p_reads_all %+% d_full[d_full$type == "reads" & d_full$genes == "ubiq", ]
p_reads_filter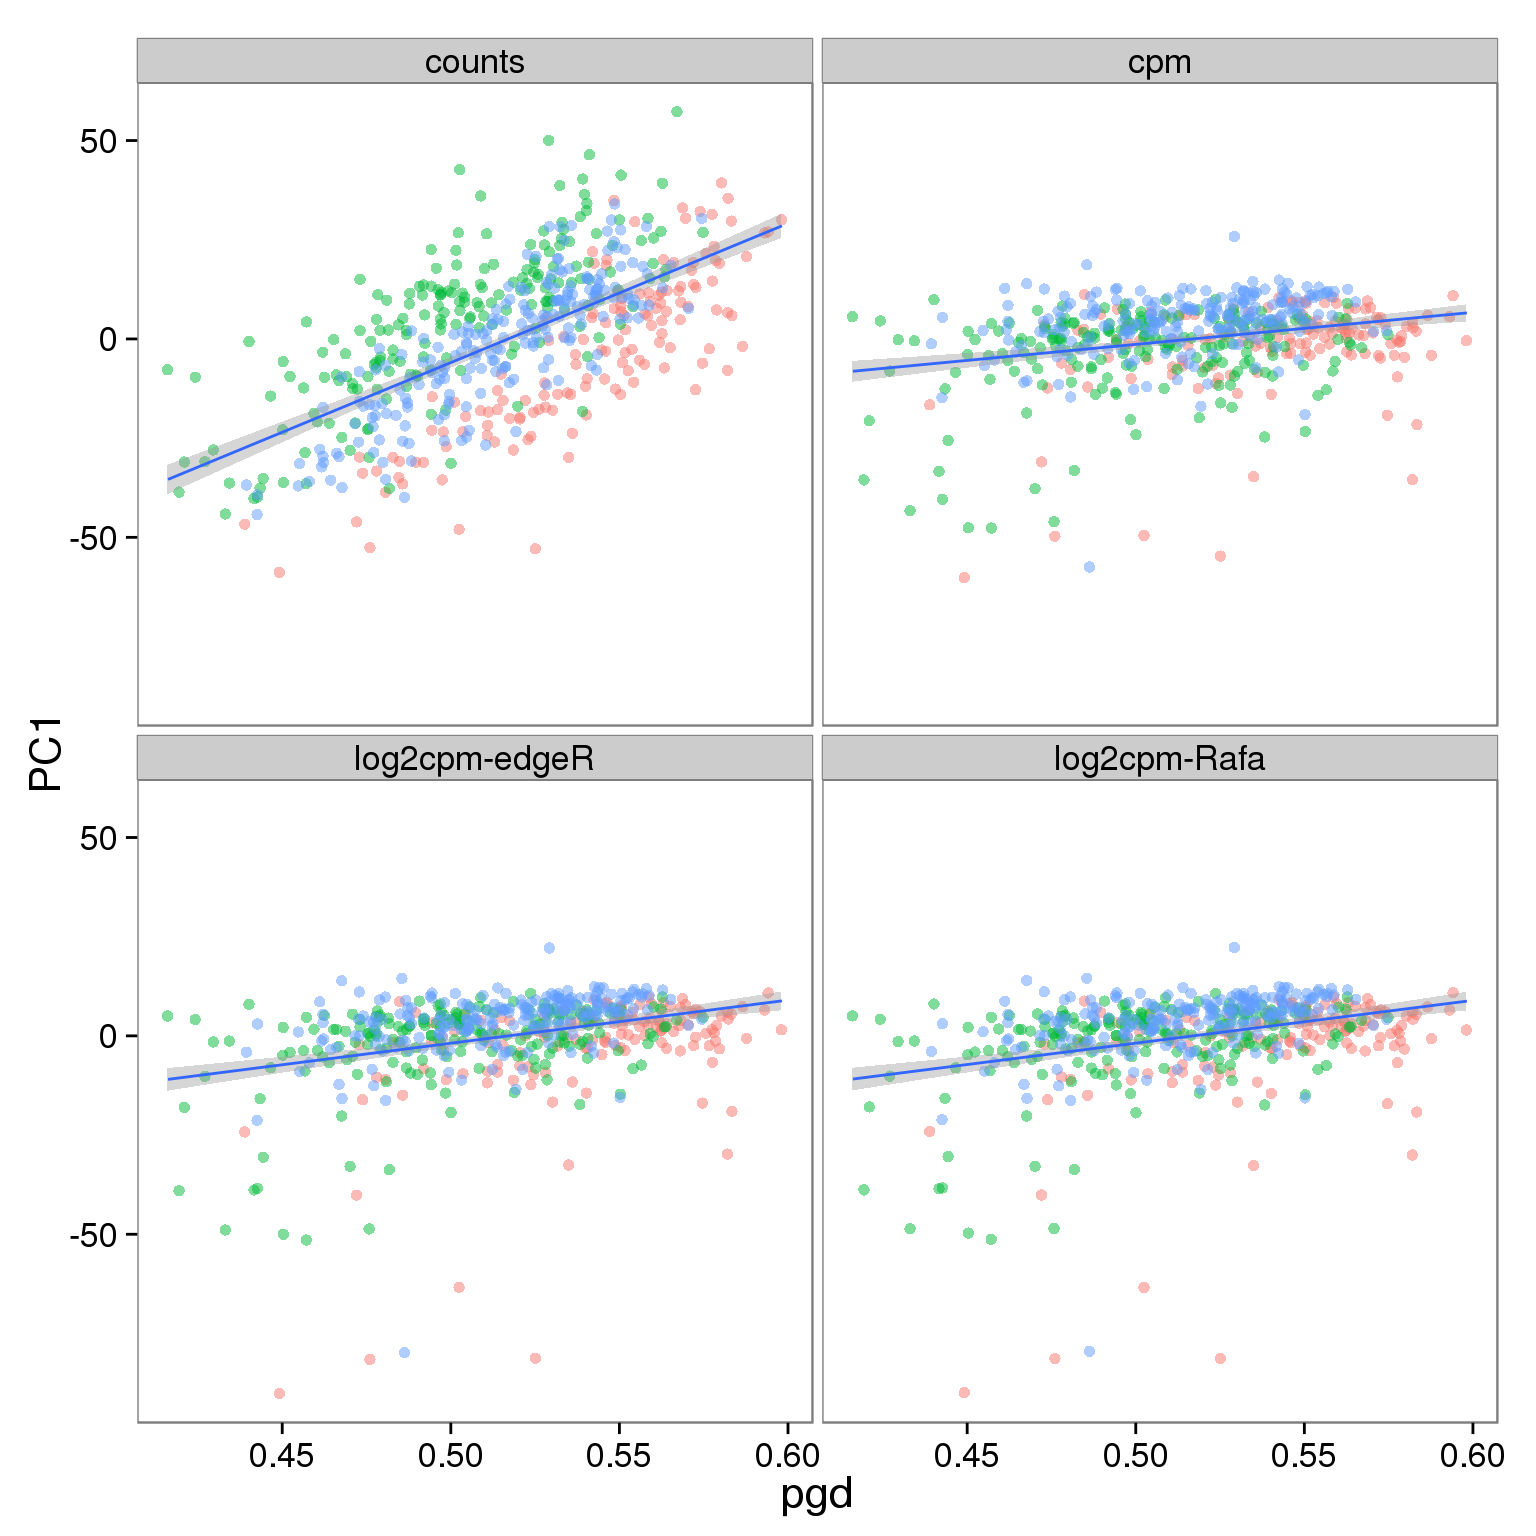
Effect of processing on molecules using ubiquitous genes:
p_molecules_filter <- p_reads_all %+% d_full[d_full$type == "molecules" & d_full$genes == "ubiq", ]
p_molecules_filter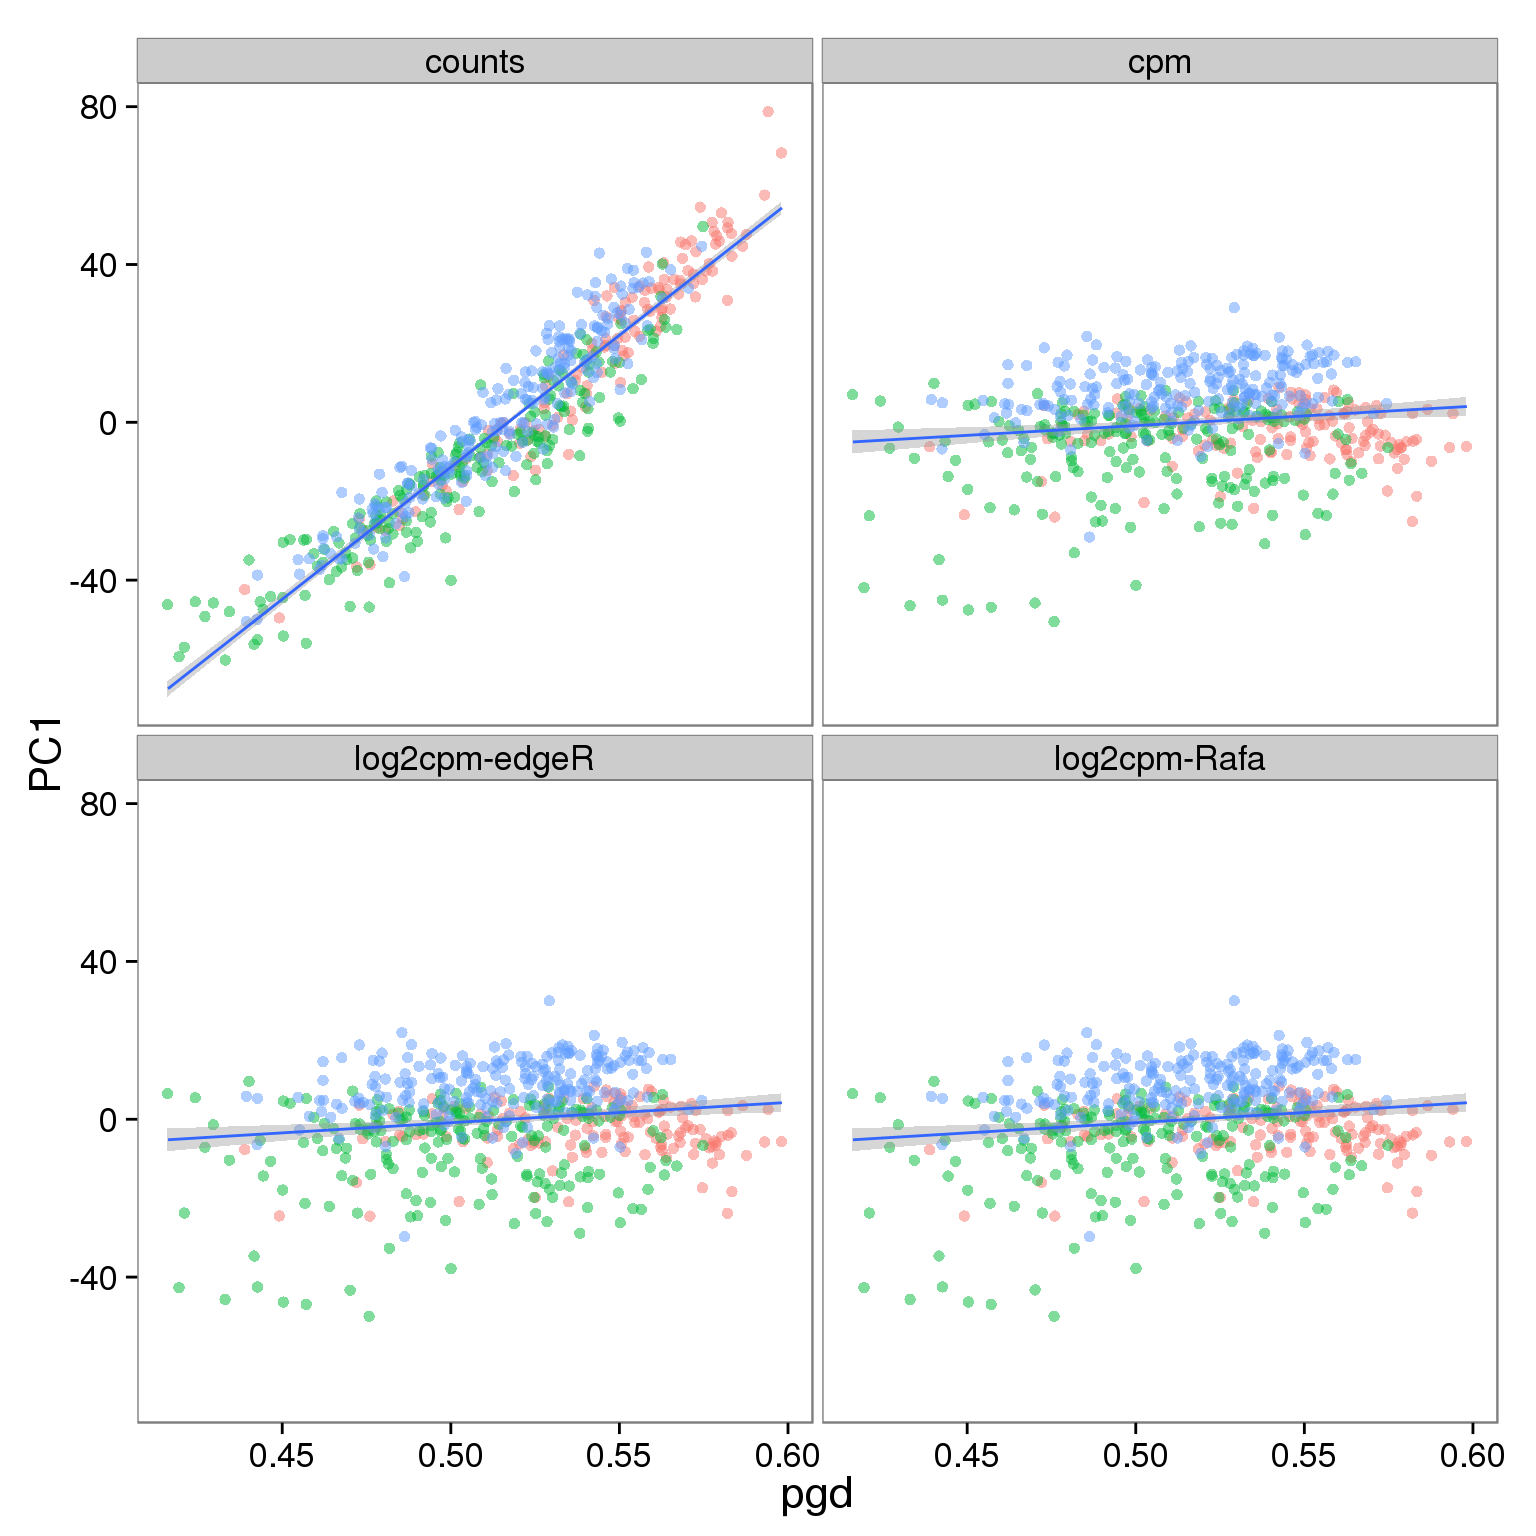
Conclusions
- Little difference whether using all observed genes or filtered set
- Only reads, and not molecules, affected by PGD effect
- Adding the pseudocount before (edgeR) or after (Rafa) calculating the CPM makes little difference
Session information
sessionInfo()R version 3.2.0 (2015-04-16)
Platform: x86_64-unknown-linux-gnu (64-bit)
locale:
[1] LC_CTYPE=en_US.UTF-8 LC_NUMERIC=C
[3] LC_TIME=en_US.UTF-8 LC_COLLATE=en_US.UTF-8
[5] LC_MONETARY=en_US.UTF-8 LC_MESSAGES=en_US.UTF-8
[7] LC_PAPER=en_US.UTF-8 LC_NAME=C
[9] LC_ADDRESS=C LC_TELEPHONE=C
[11] LC_MEASUREMENT=en_US.UTF-8 LC_IDENTIFICATION=C
attached base packages:
[1] stats graphics grDevices utils datasets methods base
other attached packages:
[1] testit_0.4 cowplot_0.3.1 ggplot2_1.0.1 tidyr_0.2.0 edgeR_3.10.2
[6] limma_3.24.9 knitr_1.10.5
loaded via a namespace (and not attached):
[1] Rcpp_0.12.0 magrittr_1.5 MASS_7.3-40 munsell_0.4.2
[5] colorspace_1.2-6 stringr_1.0.0 httr_0.6.1 plyr_1.8.3
[9] tools_3.2.0 grid_3.2.0 gtable_0.1.2 htmltools_0.2.6
[13] yaml_2.1.13 digest_0.6.8 reshape2_1.4.1 formatR_1.2
[17] codetools_0.2-11 bitops_1.0-6 RCurl_1.95-4.6 evaluate_0.7
[21] rmarkdown_0.6.1 labeling_0.3 stringi_0.4-1 scales_0.2.4
[25] proto_0.3-10