Subsample high coverage single cells
2015-07-13
Last updated: 2016-01-15
Code version: ab0cf1f917a4c115e9ee44403eb62e837e1795ae
library("dplyr")
library("ggplot2")
library("cowplot")
theme_set(theme_bw(base_size = 14))
Batch process each subsampled data set
Run for each single cell for each sequencing depth. The analysis is performed by detect-genes.R.
cd $ssd/lcl/full-lane
mkdir -p genes-detected
mkdir -p ~/log/detect-genes.R
CELLS=1
SEED=1
for WELL in A9E1 B2E2 B4H1 D2H2
do
  for NUM in 200000 1000000 10000000 20000000 30000000 40000000 50000000
  do
    for GENE in ENSG ERCC
    do
      # Molecules
      CMD="detect-genes.R $CELLS $SEED molecule-counts-$NUM.txt --min_count=1 --min_cells=1 --wells=$WELL --gene=$GENE"
      DEST="genes-detected/molecule-$WELL-$CELLS-$SEED-$NUM-$GENE.txt"
      echo "$CMD > $DEST" | qsub -l h_vmem=2g -cwd -V -N detect-molecule-$WELL-$CELLS-$SEED-$NUM-$GENE -j y -o ~/log/detect-genes.R -l 'hostname=!bigmem01'
      sleep .01s
      # Reads
      CMD="detect-genes.R $CELLS $SEED read-counts-$NUM.txt --min_count=10 --min_cells=1 --wells=$WELL --gene=$GENE"
      DEST="genes-detected/read-$WELL-$CELLS-$SEED-$NUM-$GENE.txt"
      echo "$CMD > $DEST" | qsub -l h_vmem=2g -cwd -V -N detect-read-$WELL-$CELLS-$SEED-$NUM-$GENE -j y -o ~/log/detect-genes.R -l 'hostname=!bigmem01'
      sleep .01s
    done
  done
done
Convert to one file using Python. Run from $ssd/lcl/full-lane.
import os
import glob
files = glob.glob("genes-detected/*txt")
out = open("genes-detected.txt", "w")
out.write("type\twell\tdepth\tfeatures\tnum_cells\tseed\tgenes\tmean_counts\n")
for fname in files:
    fname_parts = os.path.basename(fname).rstrip(".txt").split("-")
    type = fname_parts[0]
    well = fname_parts[1]
    depth = fname_parts[4]
    features = fname_parts[5]
    f = open(fname, "r")
    out.write(type + "\t" + well + "\t" + depth + "\t" + features + "\t" + f.read())
    f.close()

out.close()
Number of genes detected
genes_data <- read.table("/mnt/gluster/data/internal_supp/singleCellSeq/lcl/full-lane/genes-detected.txt",
                         header = TRUE, sep = "\t", stringsAsFactors = FALSE)
genes_data$depth <- as.factor(genes_data$depth)
levels(genes_data$depth) <- c("0.2", "1", "10", "20", "30", "40", "50")
For the analysis of read counts, a gene was detected if it had greater than 10 reads. For the analysis of molecule counts, a gene was detected if it had greater than 1 molecule.
Endogenous genes
genes <- ggplot(genes_data[genes_data$features == "ENSG", ],
            aes(x = as.factor(depth), y = genes)) +
  geom_boxplot() +
  geom_point(aes(color = as.factor(depth), shape = well)) +
  facet_wrap(~type) +
  labs(x = "Sequencing depth (millions)",
       y = "Number of genes detected",
       color = "Depth",
       title = "Subsample: Number of genes detected")
genes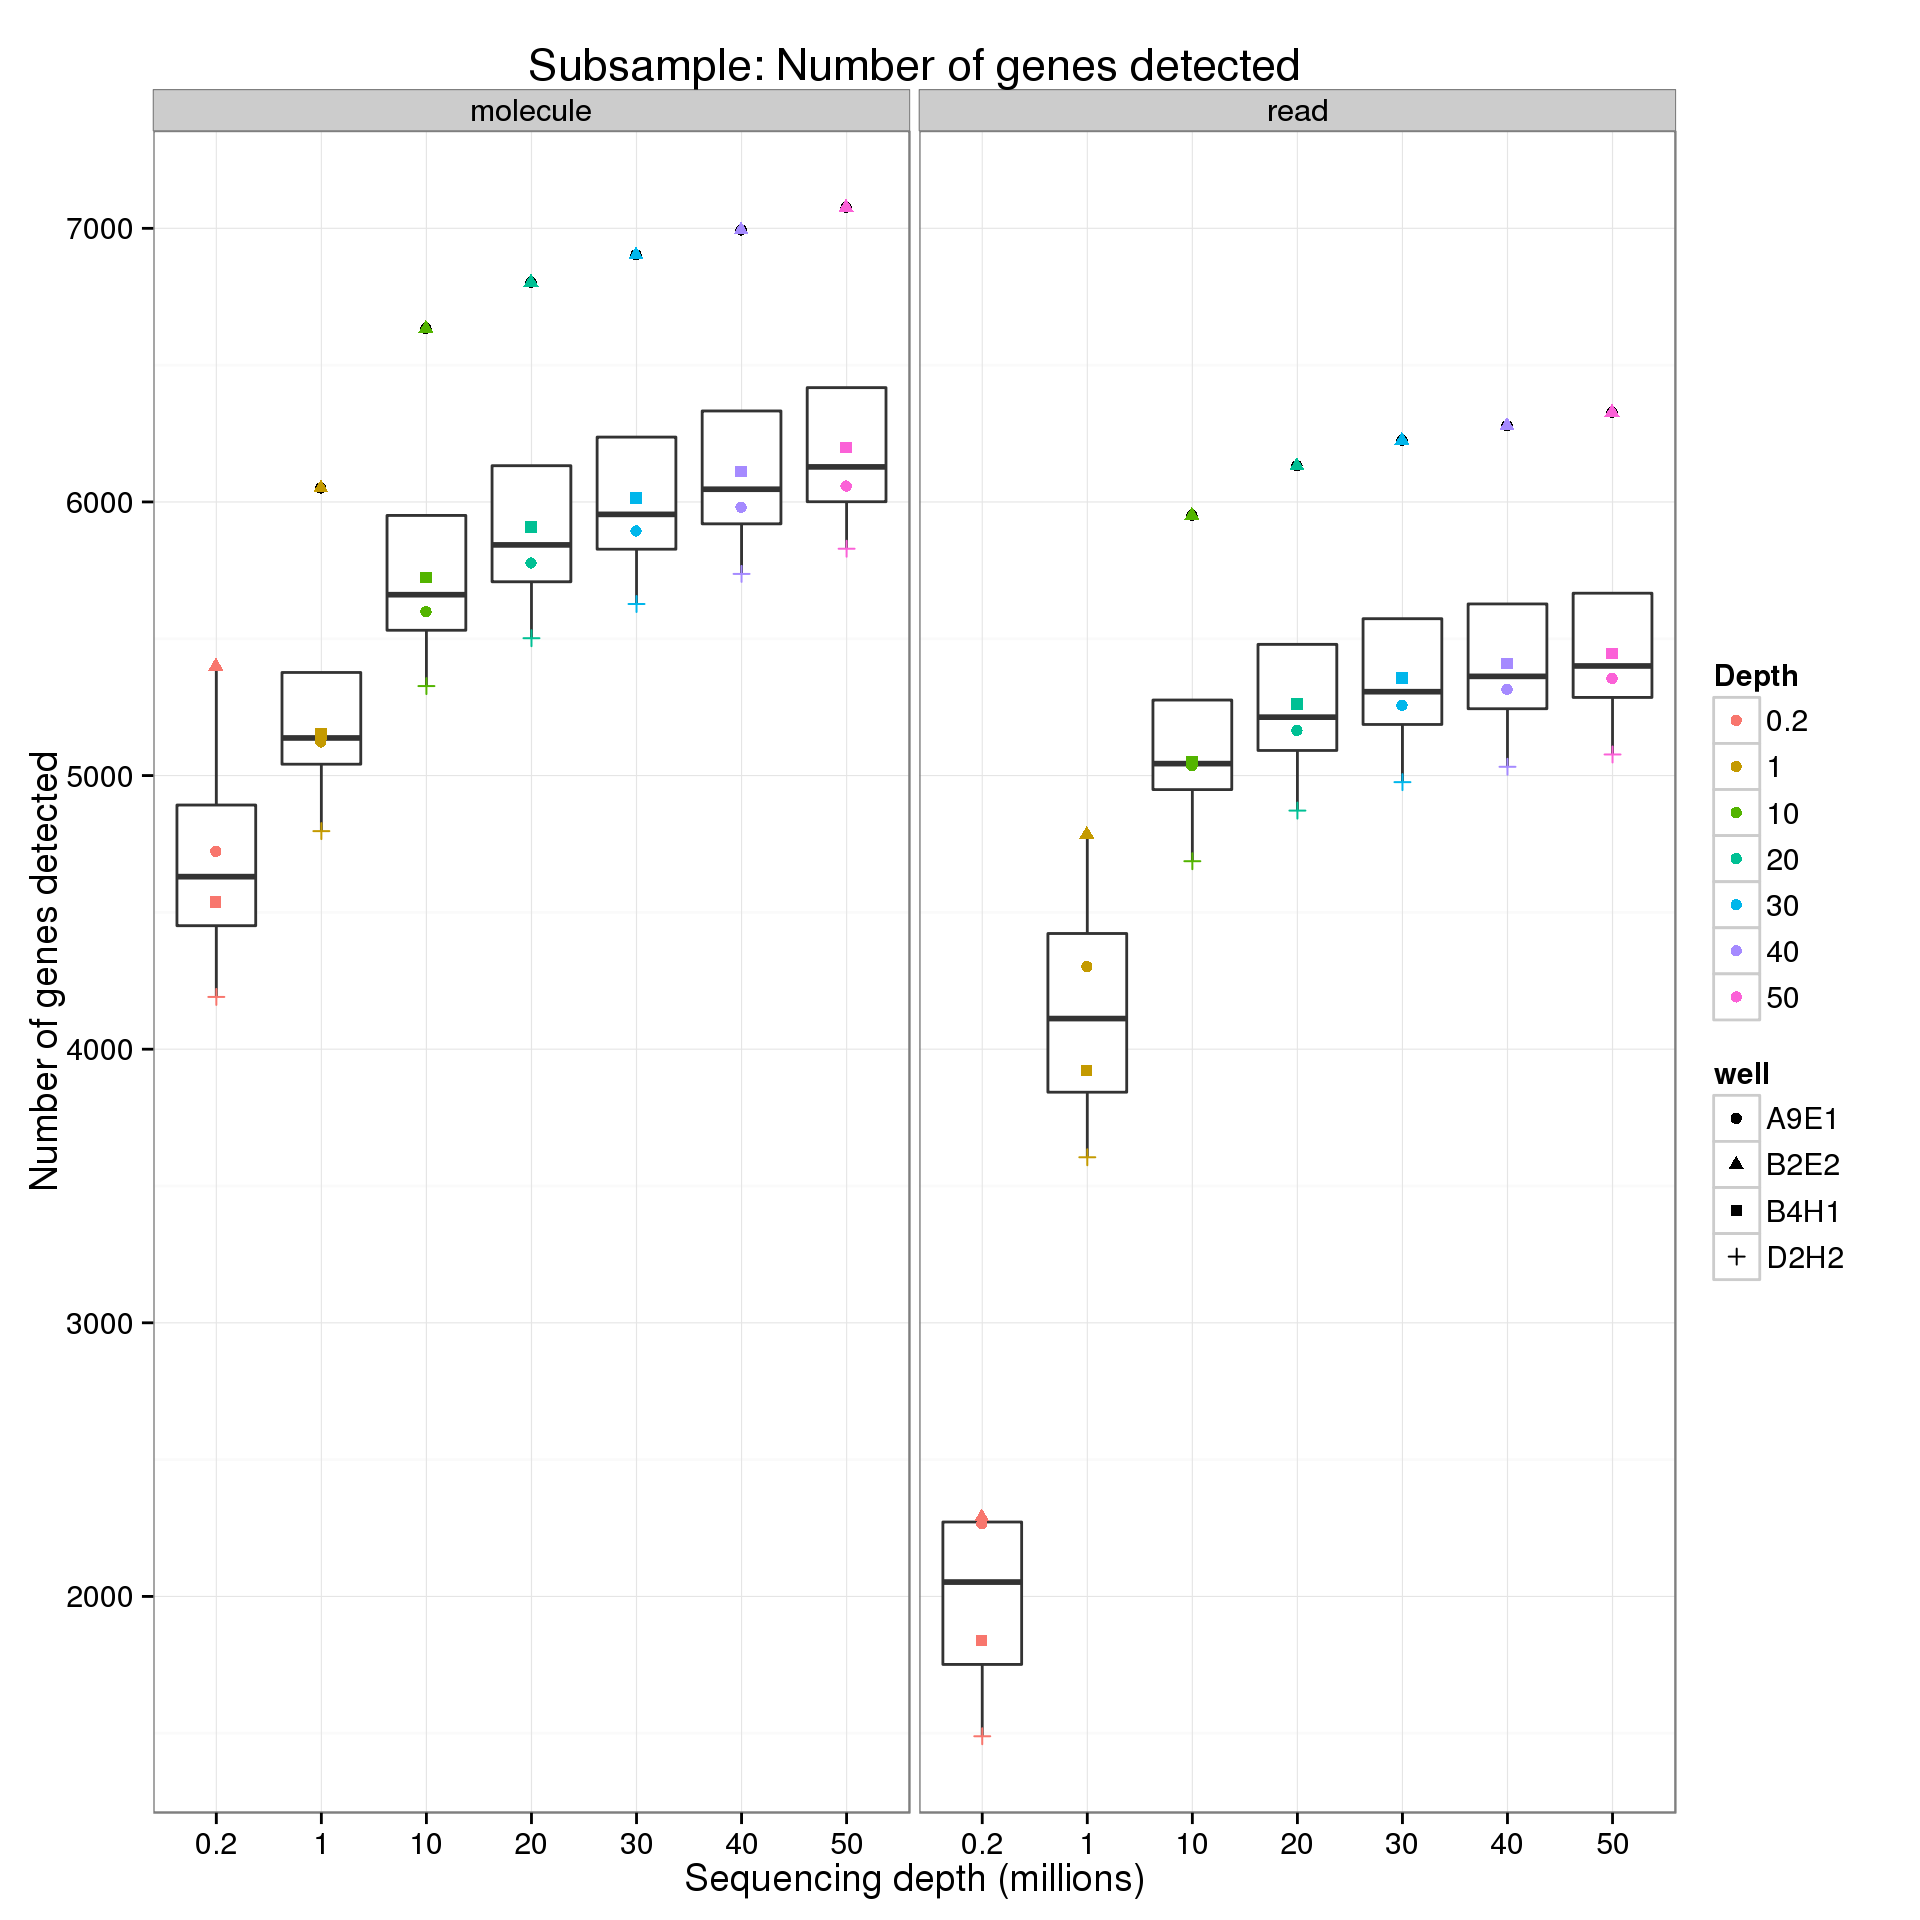
ERCC
ercc <- genes %+% genes_data[genes_data$features == "ERCC", ]
ercc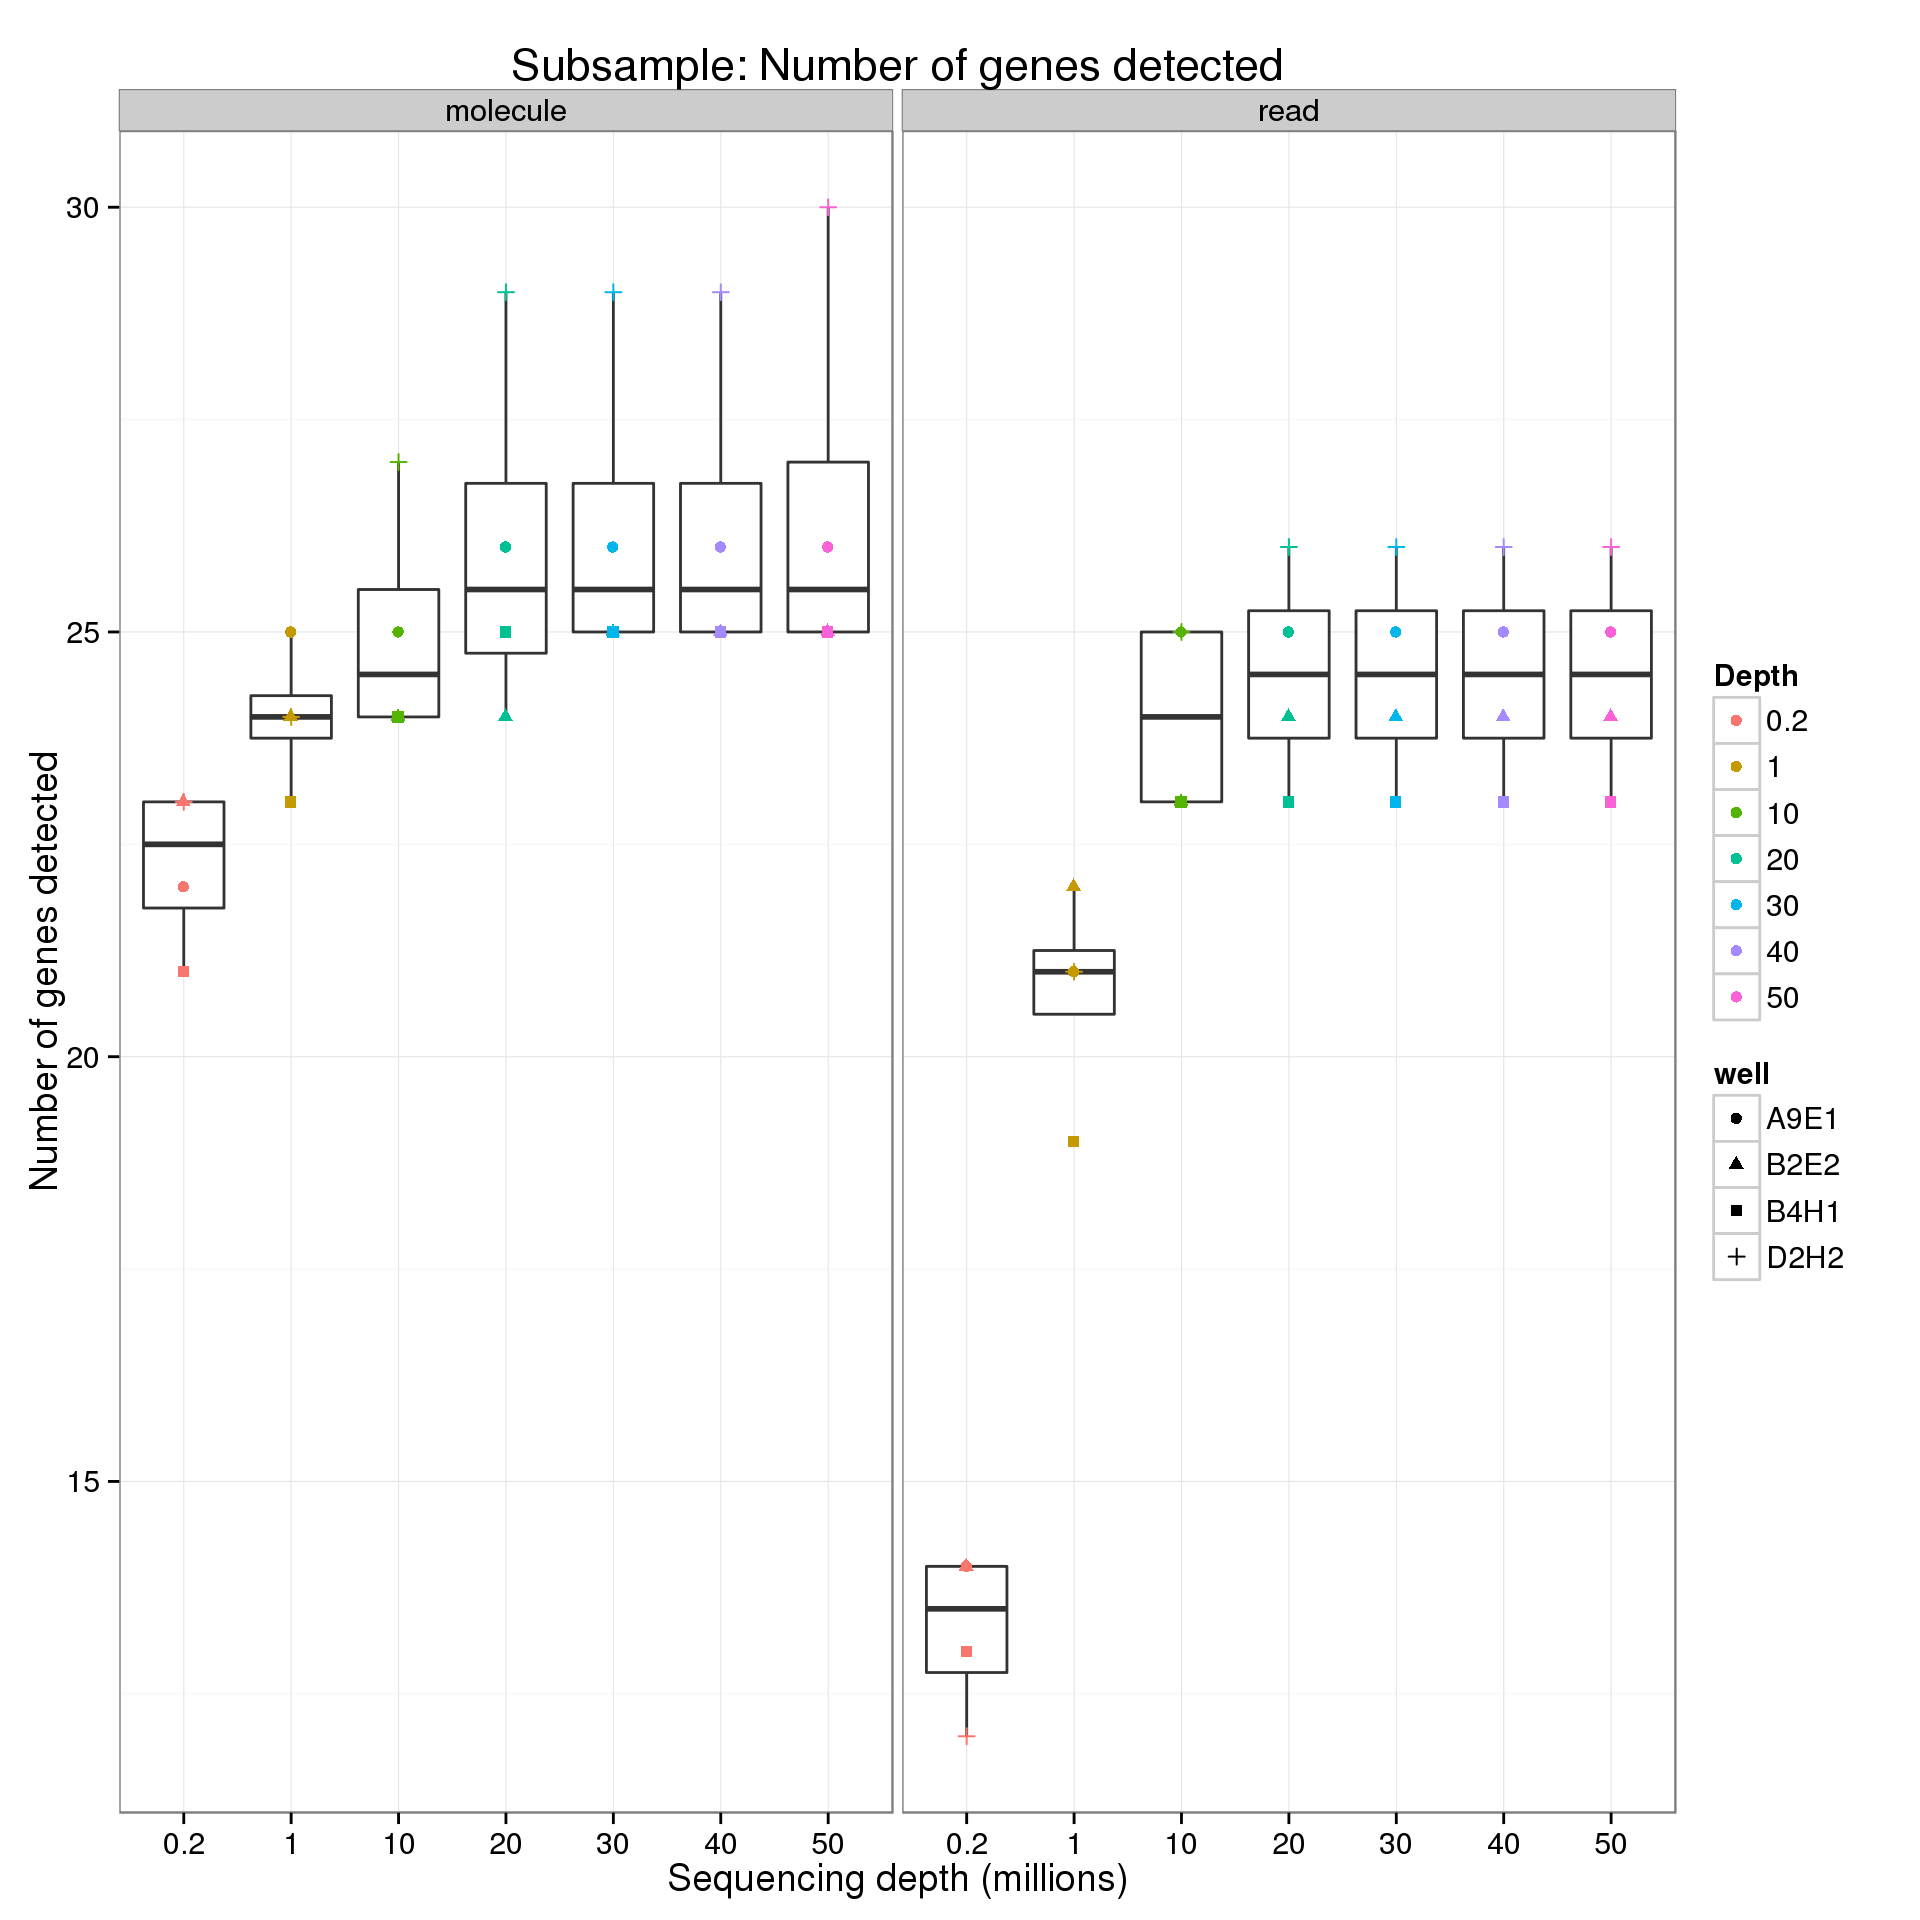
Number of total counts
Explore the effect of subsampling sequencing depth on the total count. Only includes counts of genes which had the minumum count (10 reads; 1 molecule).
Endogenous genes - reads
p <- ggplot(genes_data[genes_data$features == "ENSG" &
                       genes_data$type == "read", ],
            aes(x = as.factor(depth), y = mean_counts)) +
  geom_boxplot() +
  geom_point(aes(color = as.factor(depth), shape = well)) +
  labs(x = "Sequencing depth (millions)",
       y = "Total count",
       color = "Depth",
       title = "Subsample: Endogenous genes, reads")
reads_gene <- p
reads_gene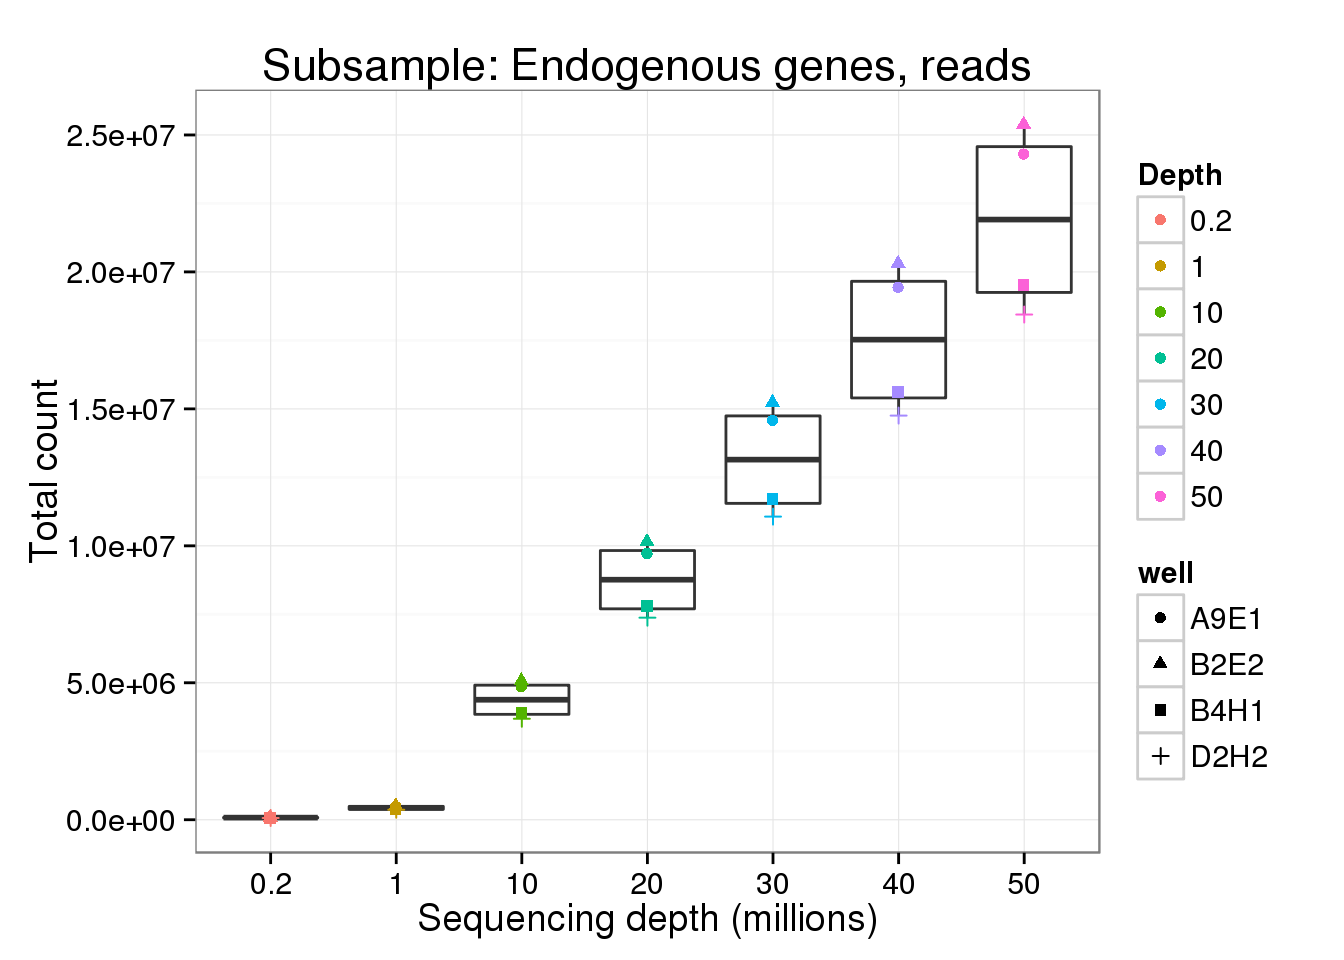
Endogenous genes - molecules
molecule_gene <-  p %+% genes_data[genes_data$features == "ENSG" &
                  genes_data$type == "molecule", ] +
                  labs(y = "Total count",
                  title = "Subsample: Endogenous genes, molecules")
molecule_gene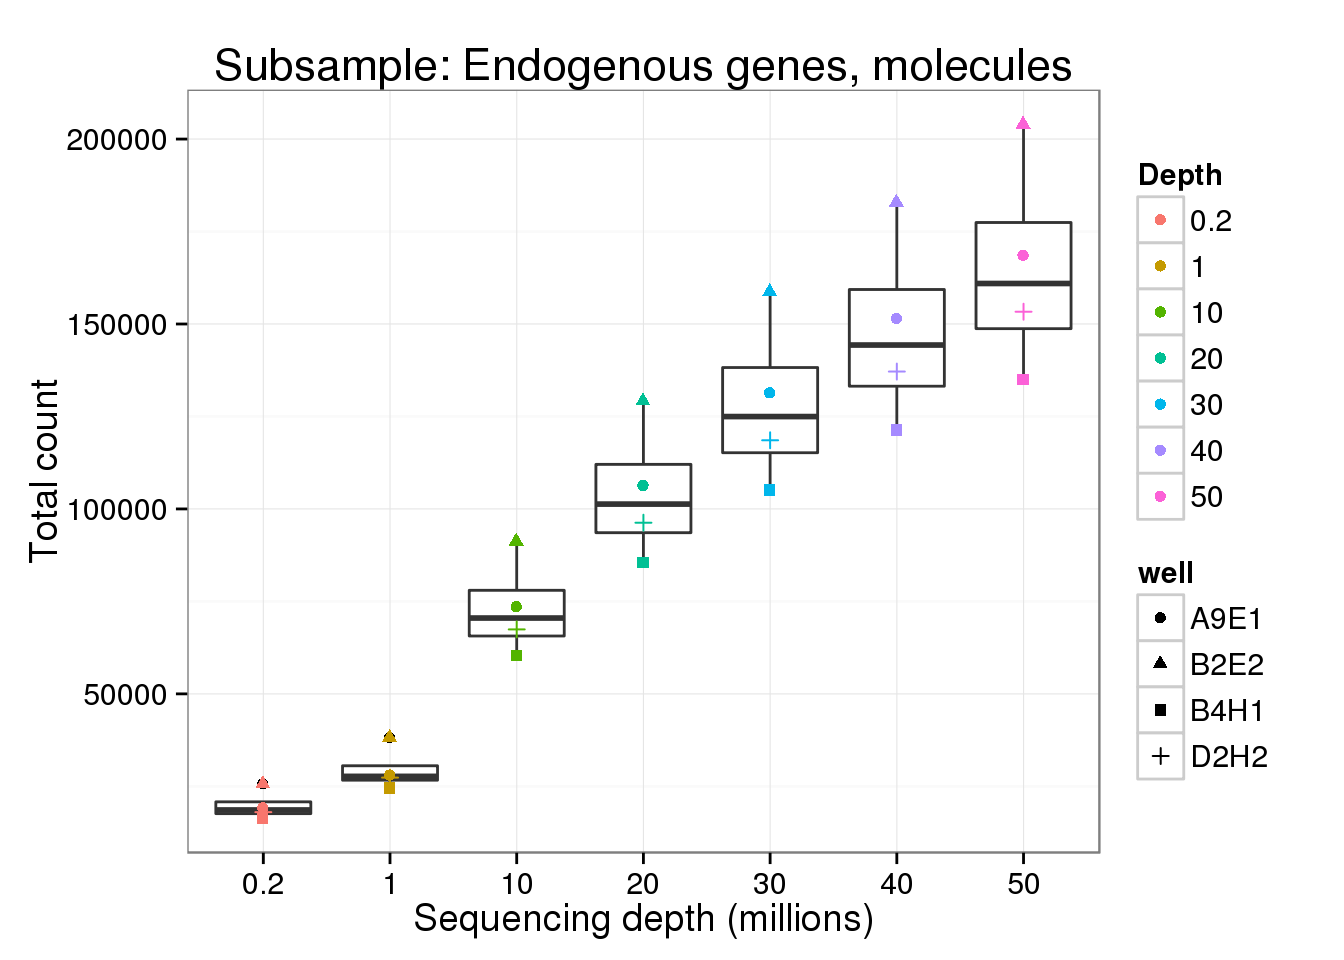
ERCC - reads
read_ercc <- p %+% genes_data[genes_data$features == "ERCC" &
                 genes_data$type == "read", ] +
  labs(y = "Total count",
       title = "Subsample: ERCC, reads")
read_ercc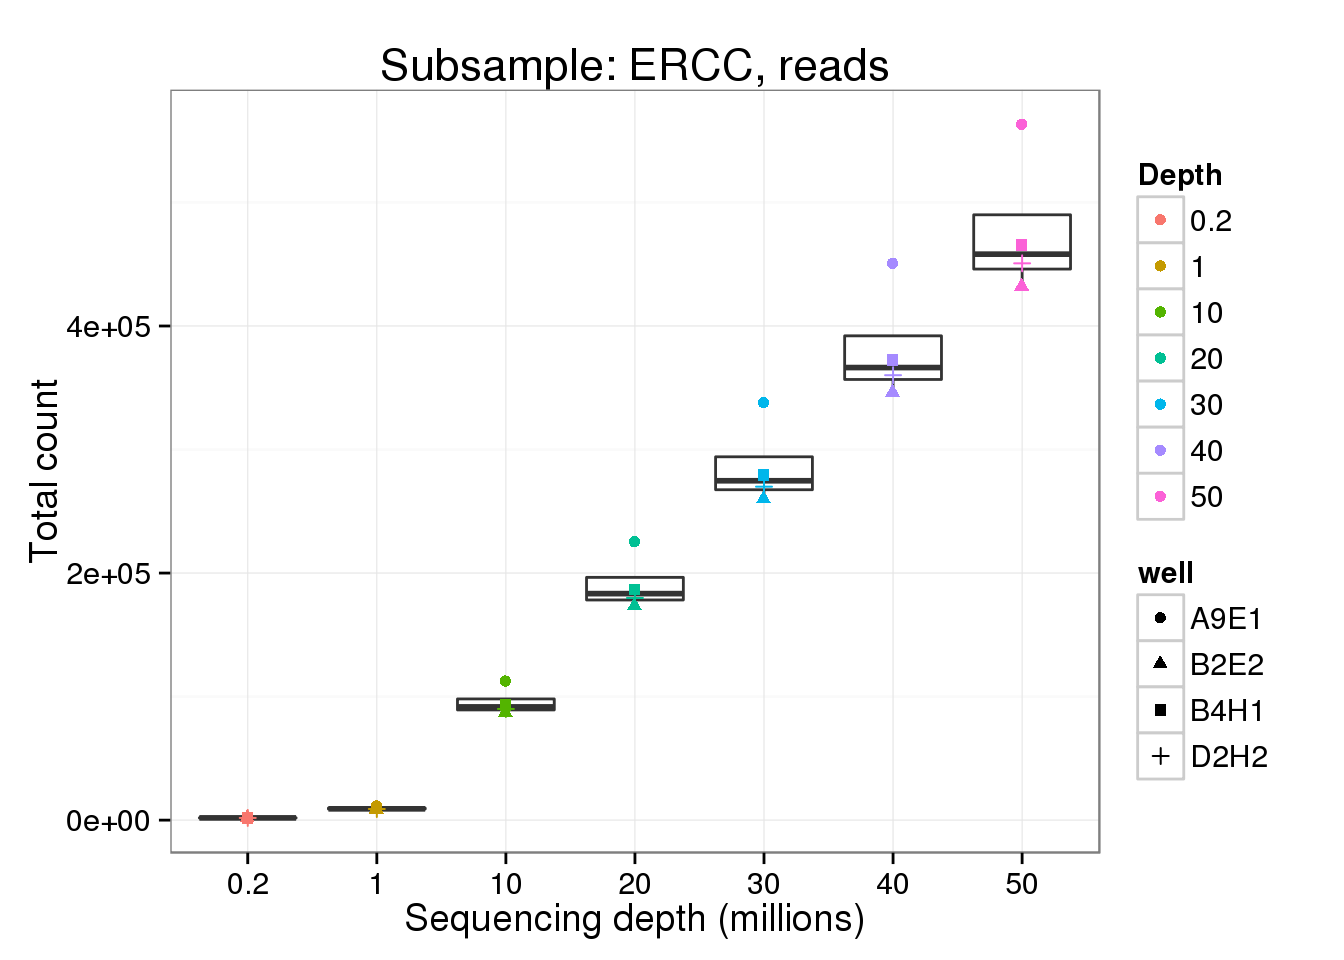
ERCC - molecules
molecule_ercc <- p %+% genes_data[genes_data$features == "ERCC" &
                 genes_data$type == "molecule", ] +
  labs(y = "Total count",
       title = "Subsample: ERCC, molecules")
molecule_ercc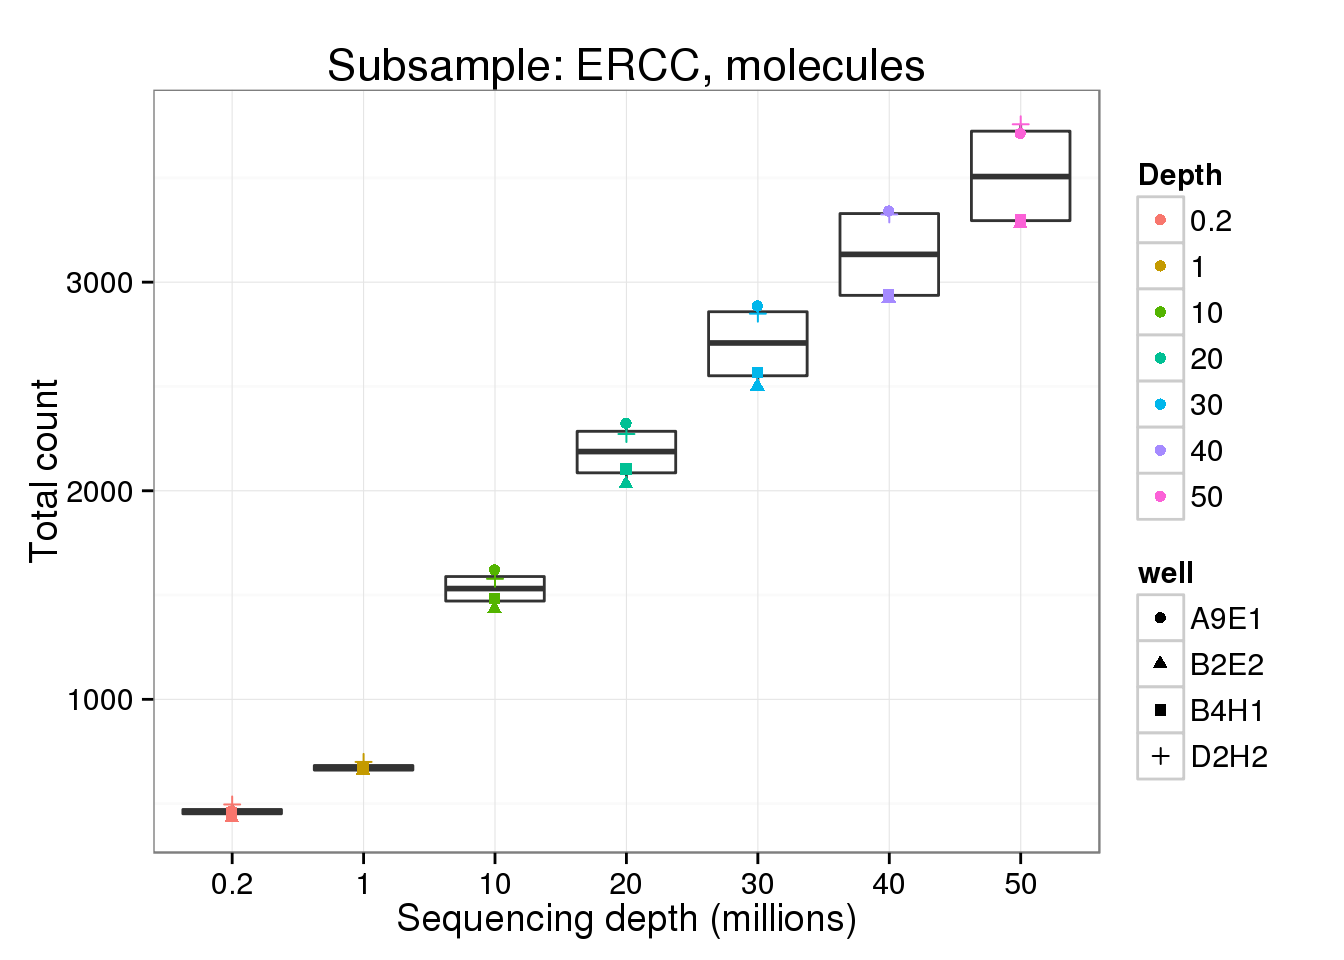
Sample concentrations
The cDNA concentrations are listed as followed:
- A9E1: 1.73 ng/ul
- B2E2: 2.25 ng/ul
- B4H1: 1.74 ng/ul
- D2H2: 1.73 ng/ul
theme_set(theme_bw(base_size = 12))
plot_grid(genes + theme(legend.position = c(.4,.35)),
          ercc + labs(title = "Subsample: Number of ERCC detected") + theme(legend.position = "none"),
          labels = LETTERS[1:2])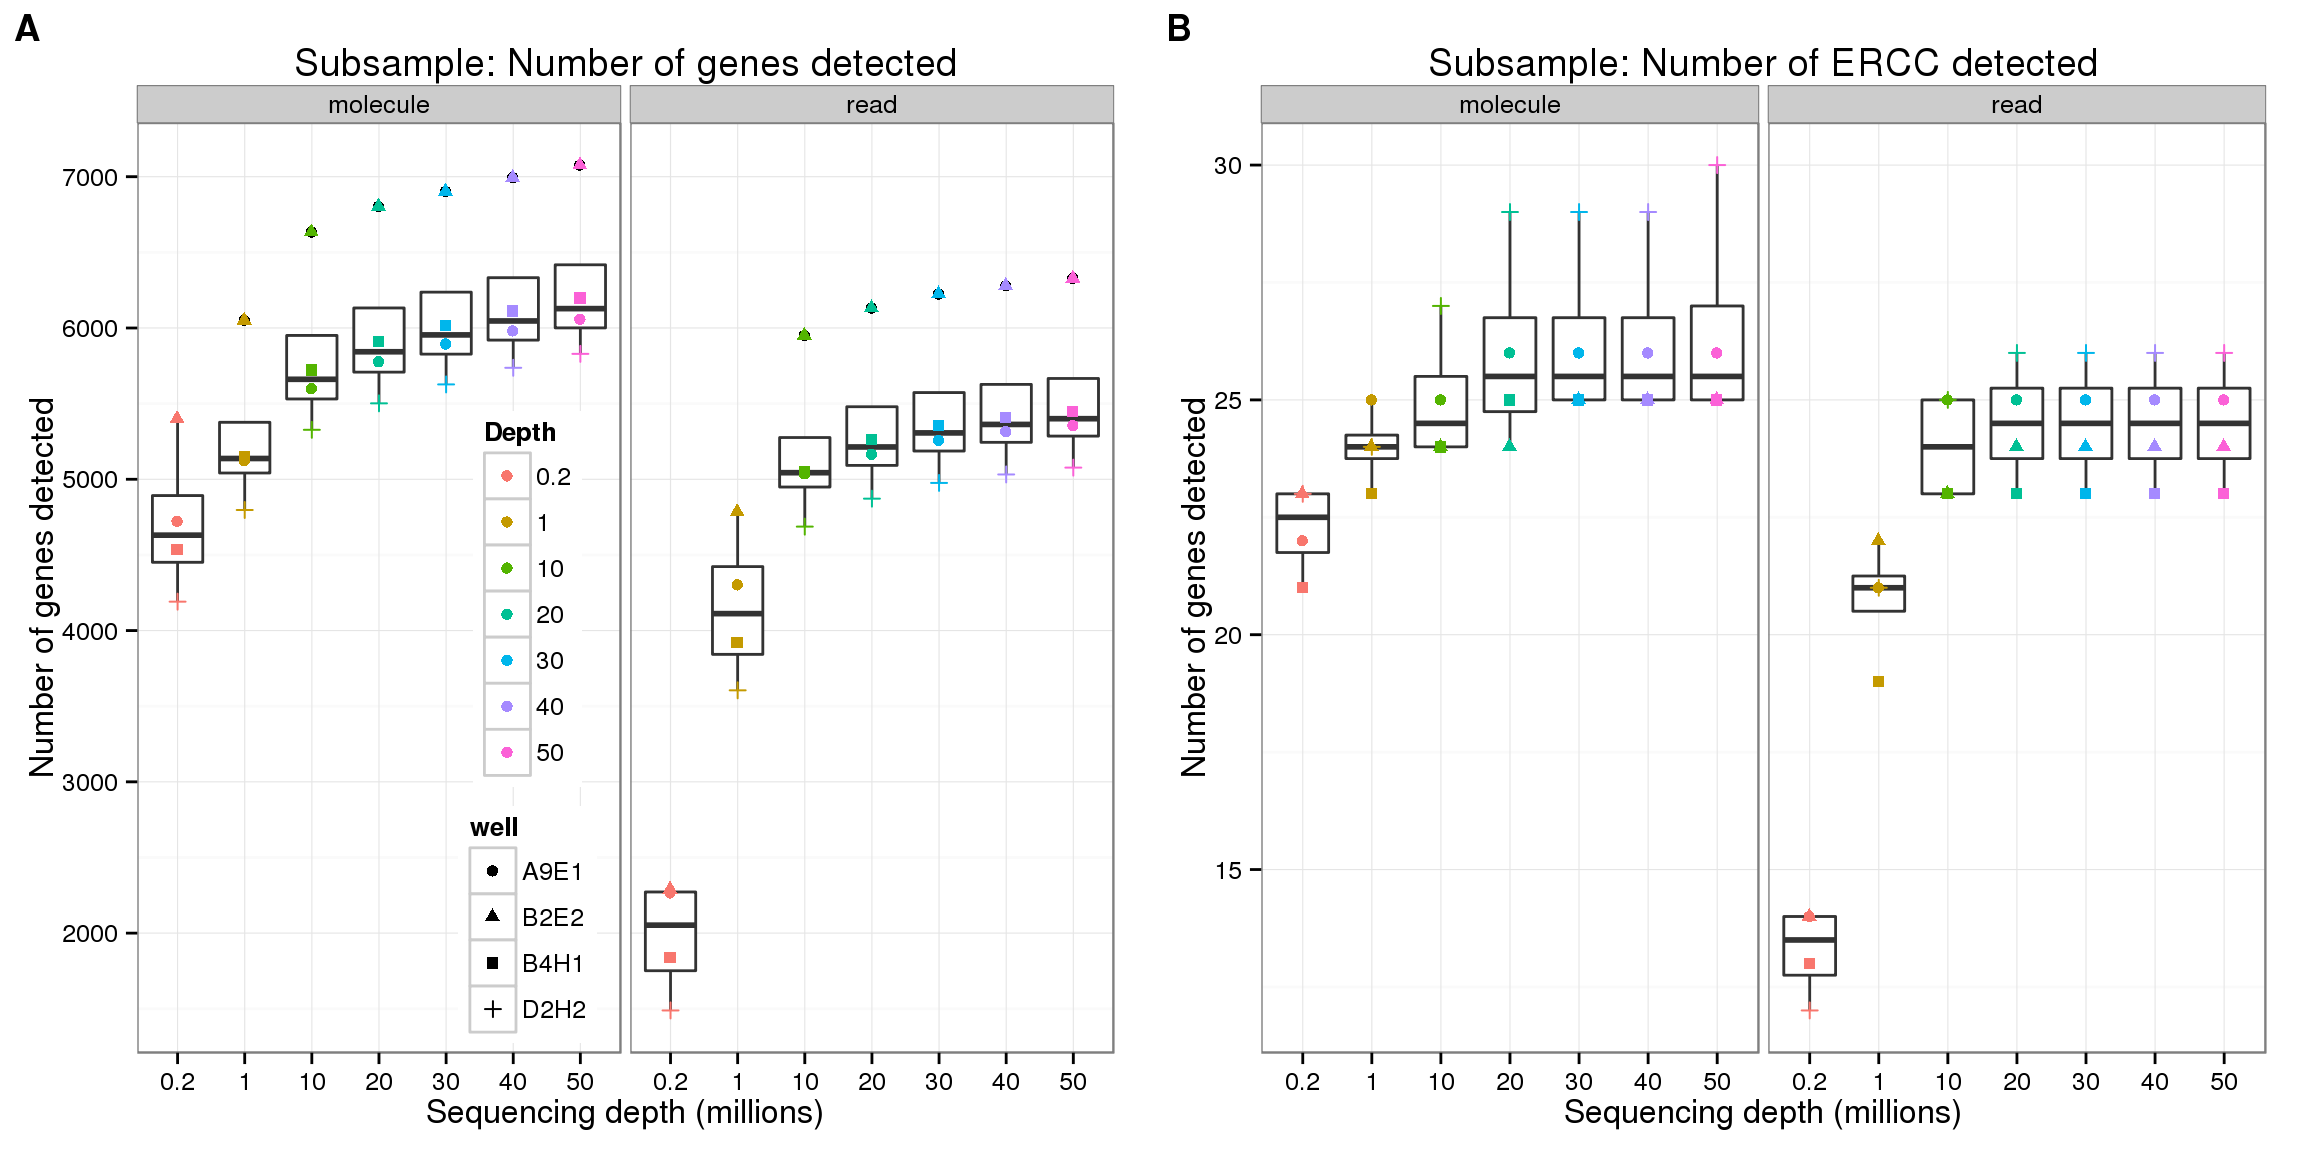
plot_grid(reads_gene + labs(title = "Genes-reads") + theme(legend.position = "none"),
          molecule_gene + labs(title = "Genes-molecules") + theme(legend.position = "none"),
          read_ercc + labs(title = "ERCC-reads") + theme(legend.position = "none"),
          molecule_ercc + labs(title = "ERCC-molecules") + theme(legend.position = "none"),
          nrow = 1,
          labels = LETTERS[3:6])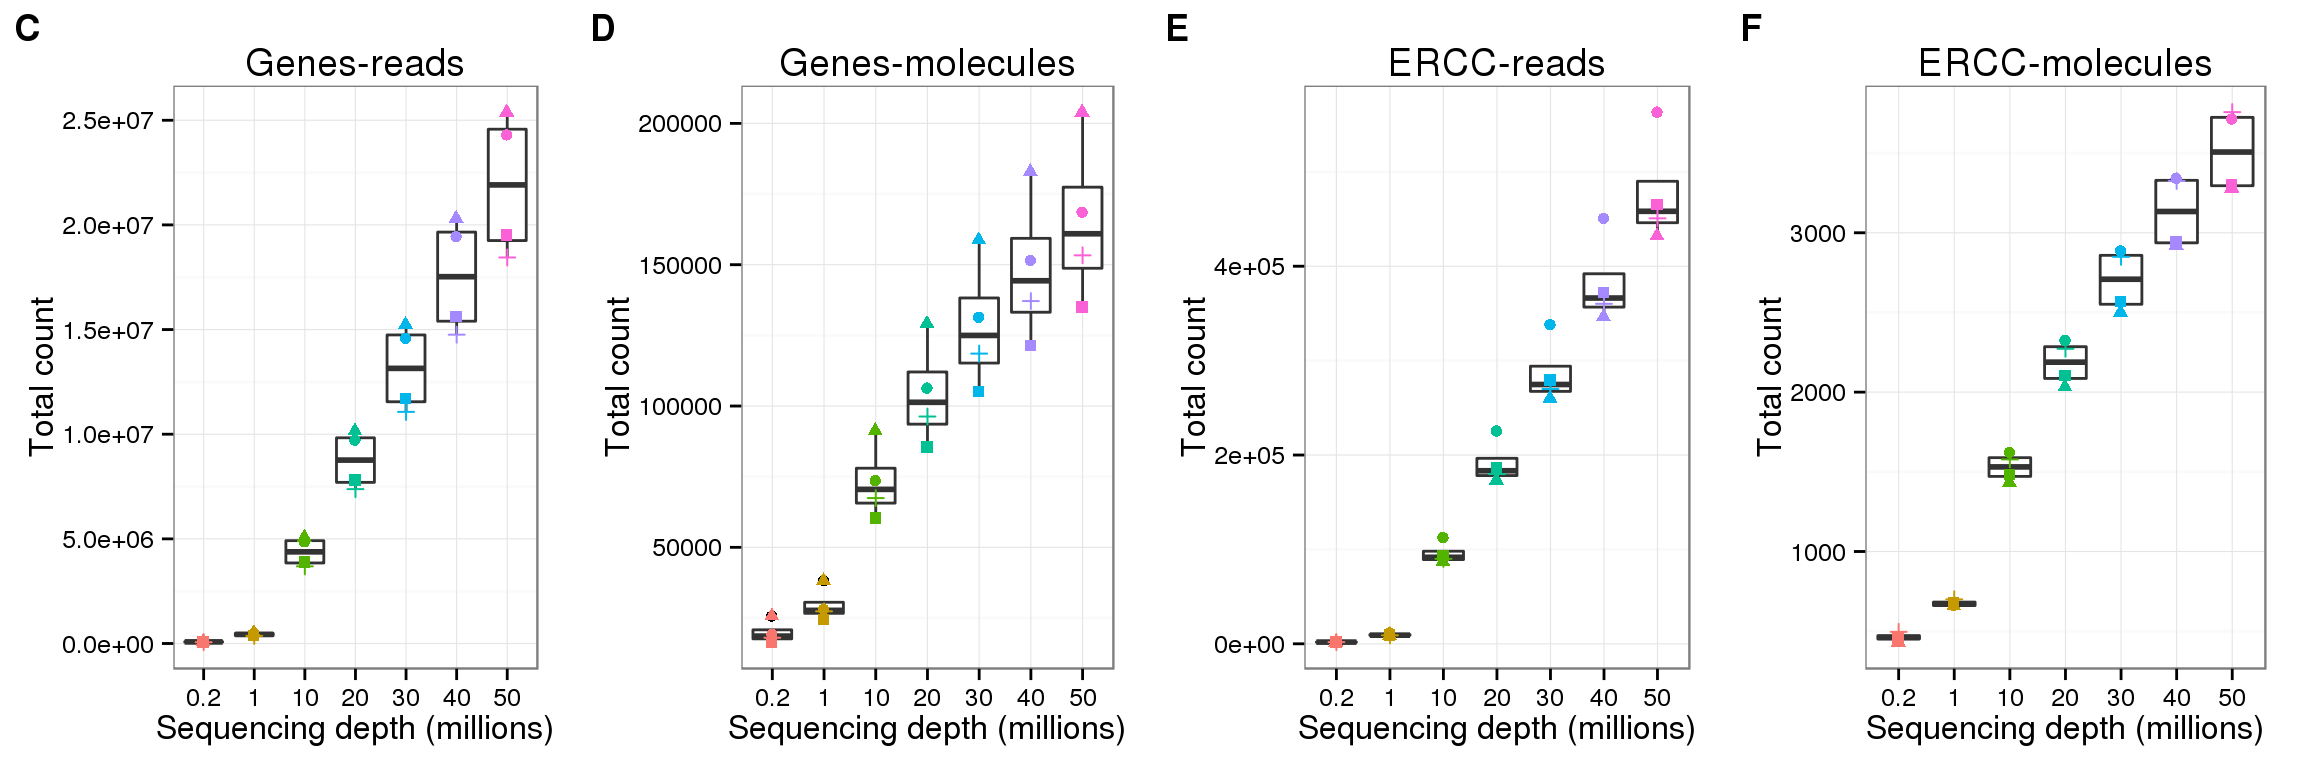
Session information
sessionInfo()R version 3.2.0 (2015-04-16)
Platform: x86_64-unknown-linux-gnu (64-bit)
locale:
[1] LC_CTYPE=en_US.UTF-8 LC_NUMERIC=C
[3] LC_TIME=en_US.UTF-8 LC_COLLATE=en_US.UTF-8
[5] LC_MONETARY=en_US.UTF-8 LC_MESSAGES=en_US.UTF-8
[7] LC_PAPER=en_US.UTF-8 LC_NAME=C
[9] LC_ADDRESS=C LC_TELEPHONE=C
[11] LC_MEASUREMENT=en_US.UTF-8 LC_IDENTIFICATION=C
attached base packages:
[1] stats graphics grDevices utils datasets methods base
other attached packages:
[1] cowplot_0.3.1 ggplot2_1.0.1 dplyr_0.4.2 knitr_1.10.5
loaded via a namespace (and not attached):
[1] Rcpp_0.12.0 magrittr_1.5 MASS_7.3-40 munsell_0.4.2
[5] colorspace_1.2-6 R6_2.1.1 stringr_1.0.0 httr_0.6.1
[9] plyr_1.8.3 tools_3.2.0 parallel_3.2.0 grid_3.2.0
[13] gtable_0.1.2 DBI_0.3.1 htmltools_0.2.6 yaml_2.1.13
[17] assertthat_0.1 digest_0.6.8 reshape2_1.4.1 formatR_1.2
[21] bitops_1.0-6 RCurl_1.95-4.6 evaluate_0.7 rmarkdown_0.6.1
[25] labeling_0.3 stringi_0.4-1 scales_0.2.4 proto_0.3-10