Noisy gene
Po-Yuan Tung
2018-01-25
Last updated: 2018-04-10
Code version: a7dd0a3
Setup
library("cowplot")
library("edgeR")
library("ggplot2")
library("knitr")
theme_set(theme_cowplot())
source("../code/functions.R")
library("Biobase") # has to be loaded last to use `combine`
Import data.
eset <- readRDS("../data/eset.rds")
dim(eset)
Features Samples
54792 7200 Keep human genes and ERCC
eset <- eset[fData(eset)$source %in% c("H. sapiens", "ERCC") , ]
dim(eset)
Features Samples
20419 7200 Only keep high-quality single cells.
quality <- read.table("../data/quality-single-cells.txt", stringsAsFactors = FALSE)
colnames(quality) <- c("sample", "quality")
eset <- eset[, quality$quality]
dim(eset)
Features Samples
20419 5221 Remove zeros.
eset <- eset[rowSums(exprs(eset)) != 0, ]
anno <- pData(eset)
dim(eset)
Features Samples
19861 5221 Mean and CV
First, we need to correct for collision probability.
eset_data <- exprs(eset)
stopifnot(nrow(anno) == ncol(eset_data))
eset_data_cr <- as.data.frame(-4^6*log(1-eset_data/4^6))
dim(eset_data_cr)
[1] 19861 5221stopifnot(nrow(anno) == ncol(eset_data_cr))Calculate mean for each gene
eset_data_cr$mean <- apply(eset_data_cr, 1, function(x) mean(x,na.rm=TRUE) )Calculate CV for each gene
eset_data_cr$CV <- apply(eset_data_cr, 1, function(x) sd(x,na.rm=TRUE) )/ apply(eset_data_cr, 1, function(x) mean(x,na.rm=TRUE))Plot CV vs mean
## plot with color-blind-friendly palettes
cbPalette <- c("#999999", "#0000FF", "#56B4E9", "#009E73", "#F0E442", "#0072B2", "#D55E00", "#CC79A7")

## create a flag to ERCC
eset_data_cr$ERCC <- grepl("ERCC",rownames(eset_data_cr))

## plot
ggplot(eset_data_cr, aes(x = mean, y = CV, col = ERCC))  +
  geom_point(size = 2, alpha = 0.5)  +
  scale_x_log10() +
  scale_colour_manual(values=cbPalette)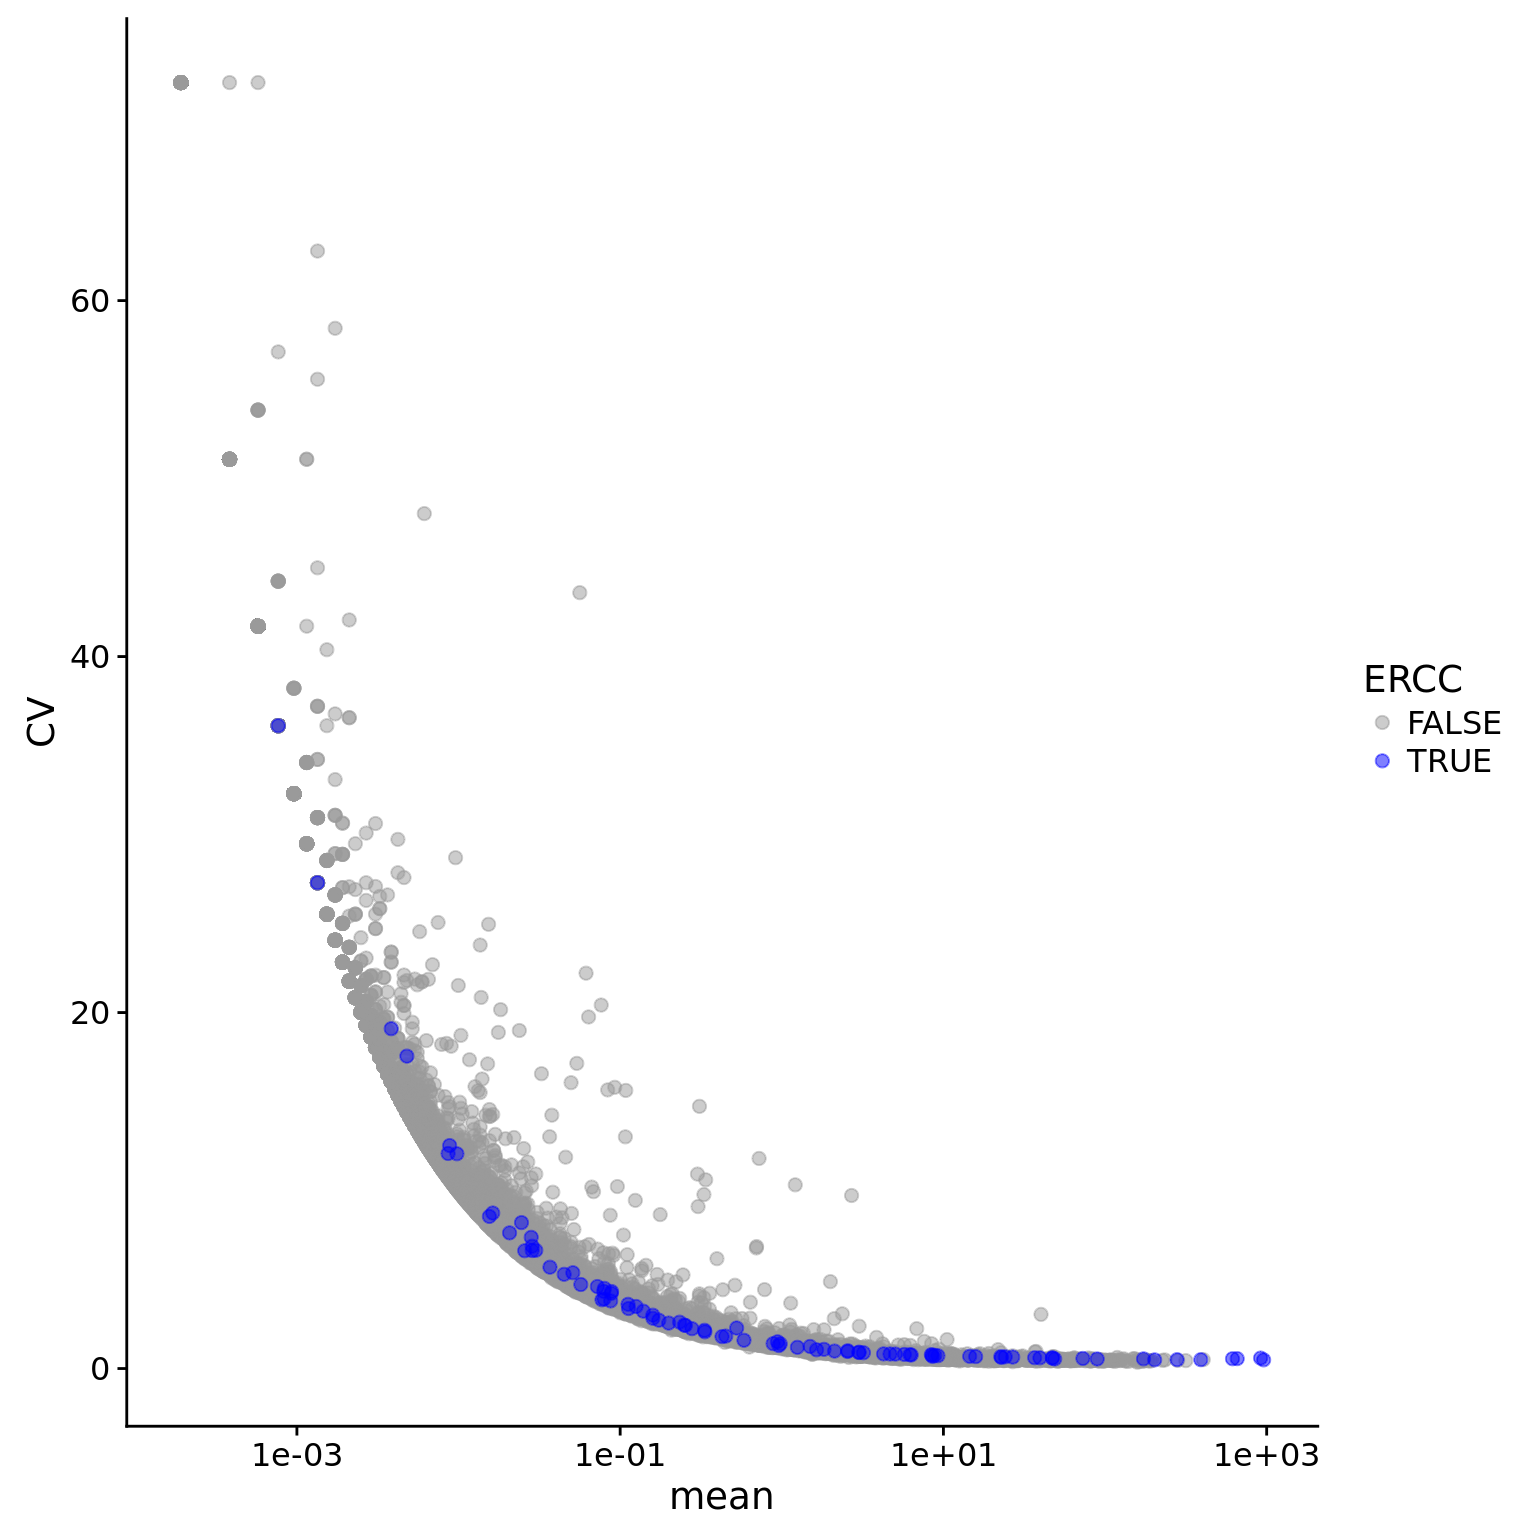
Poisson
Identification of noisy genes using the function created for the previous study
### this function will plot the mean vs cv based on the ERCC molecules counts
### only need to specify the input dataset
### the inpute dataset needs to have mean, cv and ERCC flag
### make minipar global
plot.cv.and.mean <- function(data.in){
    # model based on ERCC only
    # need to have a ERCC flag on the data.in
    molecules_single_qc_expressed_ERCC <- data.in[data.in$ERCC,]

    # compute the lossy factor based on ERCC
    ####   use LS: first define the function of f, then find the minimum
    ####   dont use the points from ERCC.mol.mean < 0.1 to fit.

    ERCC.mol.mean <- molecules_single_qc_expressed_ERCC$mean
    ERCC.mol.CV   <- molecules_single_qc_expressed_ERCC$CV

    # compute the sum of square errors
    target.fun <- function(f){
        sum((ERCC.mol.CV[ERCC.mol.mean>0.1]- sqrt(1/(f*ERCC.mol.mean[ERCC.mol.mean>0.1])))^2)
    }
    # find out the minimum
    ans <- nlminb(0.05,target.fun,lower=0.0000001,upper=1)
    minipar <- ans$par
    # use the minimum to create the lossy poisson
    lossy.posson <- function (x) {
        1/sqrt((x)*minipar)
    }

    # defnine poisson function on a log x scale
    poisson.c <- function (x) {
        x^(-0.5)
    }

     # 4 s.d.
    four.sd <- function (x) {
        4*(x)^(0.5)/(x)
    }

    # 3.7 sd + 0.3
    three.sd <- function (x) {
        3.7*(x)^(0.5)/((x))+0.3
    }

    ggplot(data.in, aes(x = mean, y = CV, col = ERCC))  +
      scale_x_log10() +
      geom_point(size = 2, alpha = 0.5) +
      stat_function(fun= poisson.c, col= "#CC79A7") +
      stat_function(fun= four.sd, col= "#F0E442") +
      stat_function(fun= lossy.posson, col= "#56B4E9") +
      ylim(0, max(data.in$CV)*1.1) +
      scale_colour_manual(values=cbPalette) +
      xlab("Average number of molecules") +
      ylab ("coefficient of variation (CV)")

}
plot.cv.and.mean(data.in=eset_data_cr)
Warning: Removed 17 rows containing missing values (geom_path).Warning: Removed 2 rows containing missing values (geom_path).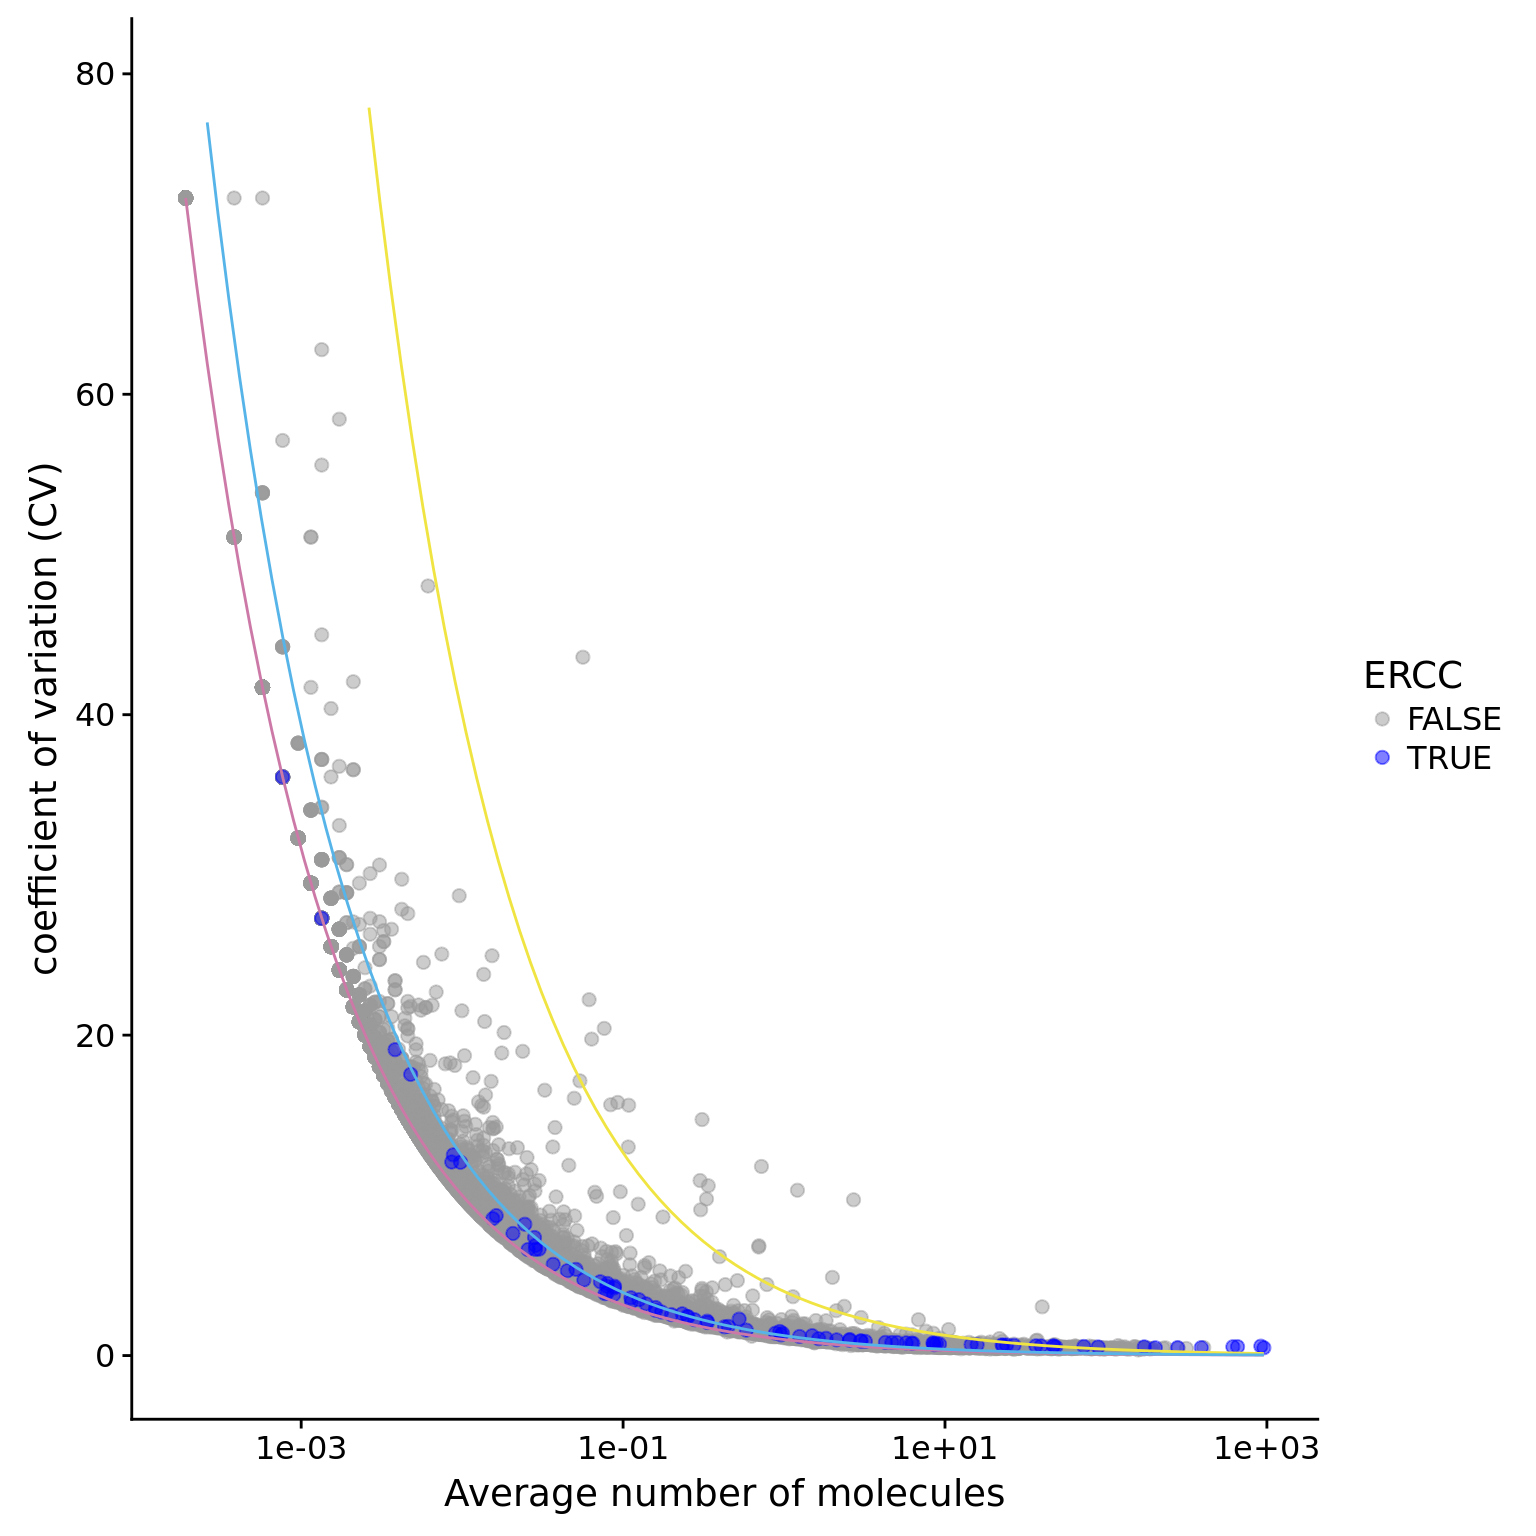
Noisy genes
### this function will identify the noisy gene based on 4 sd
### only need to specify the input dataset
### the inpute dataset needs to have mean and CV
noisy_gene <- function(data.in){

 #  larger than 4 sd
 count.index  <- (!is.na(data.in$mean))&(data.in$mean>1)
 condi.index <- (data.in$CV > 4*(data.in$mean^(0.5))/data.in$mean)

 sum(count.index&condi.index)

 rownames(data.in)[count.index&condi.index]
}

# noisy genes of all sampels
noisy_gene_all <- noisy_gene(data.in=eset_data_cr)
noisy_gene_all
[1] "ENSG00000002822" "ENSG00000008988" "ENSG00000034510"
[4] "ENSG00000062716" "ENSG00000070756" "ENSG00000071082"
[7] "ENSG00000074800" "ENSG00000075624" "ENSG00000079459"
[10] "ENSG00000080824" "ENSG00000084207" "ENSG00000087086"
[13] "ENSG00000089157" "ENSG00000092841" "ENSG00000096384"
[16] "ENSG00000100316" "ENSG00000105372" "ENSG00000108298"
[19] "ENSG00000108518" "ENSG00000108821" "ENSG00000109971"
[22] "ENSG00000110700" "ENSG00000110713" "ENSG00000111640"
[25] "ENSG00000111716" "ENSG00000115414" "ENSG00000115541"
[28] "ENSG00000117450" "ENSG00000122406" "ENSG00000123416"
[31] "ENSG00000124762" "ENSG00000125144" "ENSG00000125691"
[34] "ENSG00000127184" "ENSG00000130255" "ENSG00000131969"
[37] "ENSG00000132341" "ENSG00000136810" "ENSG00000136942"
[40] "ENSG00000137154" "ENSG00000137818" "ENSG00000138326"
[43] "ENSG00000140264" "ENSG00000142534" "ENSG00000142541"
[46] "ENSG00000143947" "ENSG00000145592" "ENSG00000149273"
[49] "ENSG00000149591" "ENSG00000156482" "ENSG00000158470"
[52] "ENSG00000161016" "ENSG00000164032" "ENSG00000164587"
[55] "ENSG00000166681" "ENSG00000167526" "ENSG00000167996"
[58] "ENSG00000172809" "ENSG00000174748" "ENSG00000175063"
[61] "ENSG00000177105" "ENSG00000177600" "ENSG00000177954"
[64] "ENSG00000181163" "ENSG00000182481" "ENSG00000182899"
[67] "ENSG00000184009" "ENSG00000185885" "ENSG00000186468"
[70] "ENSG00000187193" "ENSG00000189043" "ENSG00000189403"
[73] "ENSG00000196262" "ENSG00000197061" "ENSG00000197756"
[76] "ENSG00000198518" "ENSG00000198712" "ENSG00000198727"
[79] "ENSG00000198763" "ENSG00000198786" "ENSG00000198804"
[82] "ENSG00000198886" "ENSG00000198888" "ENSG00000198899"
[85] "ENSG00000198938" "ENSG00000204628" "ENSG00000205358"
[88] "ENSG00000212907" "ENSG00000213741" "ENSG00000228253"
[91] "ENSG00000231500" "ENSG00000240972" "ENSG00000255823"
[94] "ERCC-00002" "ERCC-00003" "ERCC-00004"
[97] "ERCC-00009" "ERCC-00046" "ERCC-00074"
[100] "ERCC-00096" "ERCC-00108" "ERCC-00113"
[103] "ERCC-00130" "ERCC-00136" "ERCC-00171" This R Markdown site was created with workflowr