UMI count distribution stratified by genotype
Setup
sbatch $RESOURCES --job-name=ipython3 --output=ipython3.out
#!/bin/bash
source activate scqtl
rm -f $HOME/.local/share/jupyter/runtime/kernel-aksarkar.json
ipython3 kernel --ip=$(hostname -i) -f kernel-aksarkar.json
Submitted batch job 39920166
%matplotlib inline

import io
import os
import matplotlib.pyplot as plt
import numpy as np
import requests
import pandas as pd
Read the data
counts = pd.read_table('/project2/mstephens/aksarkar/projects/singlecell-qtl/data/scqtl-counts.txt.gz', index_col=0)
counts.shape
(20327, 2304)
annotations = pd.read_table('/project2/mstephens/aksarkar/projects/singlecell-qtl/data/scqtl-annotation.txt')
annotations['chip_id'].value_counts()
NA18507    233
  NA18502    228
  NA18508    203
  NA18520    164
  NA18862    132
  NA19128    119
  NA19190    114
  NA19257    105
  NA18852    105
  NA18501    100
  NA18856     96
  NA18499     93
  NA18853     89
  NA18870     87
  NA19210     87
  NA19098     75
  NA18505     65
  NA19092     54
  NA19159     45
  NA19203     27
  NA19119     20
  NA18498     20
  NA19131      3
  NA18516      3
  NA19200      3
  NA19129      3
  NA19122      2
  NA18913      2
  NA19138      2
  NA18907      2
  NA19214      2
  NA19144      2
  NA19153      2
  NA18874      1
  NA18924      1
  NA19107      1
  NA18917      1
  NA18867      1
  NA19102      1
  NA19099      1
  NA18486      1
  NA18861      1
  NA19171      1
  NA19176      1
  NA19239      1
  NA18517      1
  NA18523      1
  NA19189      1
  NA19209      1
  NA18511      1
  Name: chip_id, dtype: int64
genotypes = pd.read_table('/project/compbio/jointLCLs/genotype/hg19/YRI/genotypesYRI.gen.txt.gz',
                          header=0, sep='\t')
genotypes = genotypes.rename(columns={k: 'NA{}'.format(k)
                                      for k in genotypes.columns.values[9:]})
genotypes.shape
(6278013, 128)
Download ENSEMBL to Hugo gene symbol conversion table from Biomart.
query = """<?xml version="1.0" encoding="UTF-8"?>
<!DOCTYPE Query>
<Query  virtualSchemaName = "default" formatter = "TSV" header = "0" uniqueRows = "0" count = "" datasetConfigVersion = "0.6" >

        <Dataset name = "hsapiens_gene_ensembl" interface = "default" >
                <Attribute name = "ensembl_gene_id" />
                <Attribute name = "hgnc_symbol" />
        </Dataset>
</Query>"""

resp = requests.get('http://www.ensembl.org/biomart/martservice', params={'query': query})
if resp.status_code != 200:
  raise RuntimeError
ensembl = pd.read_table(io.StringIO(resp.text), header=None, index_col=0)
ensembl.columns = ['symbol']
ensembl.head()
                symbol
0
ENSG00000210049    MT-TF
ENSG00000211459  MT-RNR1
ENSG00000210077    MT-TV
ENSG00000210082  MT-RNR2
ENSG00000209082   MT-TL1
eqtls = pd.read_table('/project/compbio/iPSC_eQTL/permutations.all.RNAseq_run.fixed.txt.gz', header=None, index_col=0, sep=' ')
eqtls.columns = ['num_variants', 'alpha', 'beta', 'dummy', 'best_eqtl', 'dist', 'p', 'effect_size', 'perm', 'beta_perm']
eqtls.index = [symbol.split('.')[0] for symbol in eqtls.index.values]
eqtls[['rsid', 'chrom', 'pos']] = eqtls.apply(lambda x: pd.Series(str(x['best_eqtl']).split('.')), axis=1)
eqtls.merge(ensembl, left_index=True, right_index=True).merge(counts, left_index=True, right_index=True).sort_values(by='beta_perm')[['symbol', 'rsid', 'effect_size', 'beta_perm']].head()
                symbol        rsid  effect_size     beta_perm
ENSG00000214941   ZSWIM7  rs73276049     1.792670  1.567000e-17
ENSG00000145725  PPIP5K2     rs34822     1.155860  1.280260e-15
ENSG00000164978    NUDT2   rs7848476     0.998739  6.685150e-15
ENSG00000243317  C7orf73   rs6467603     1.371900  1.508780e-14
ENSG00000240344    PPIL3  rs13412214    -1.343370  1.566880e-14
Look at top mean-QTLs
Plot the distribution of UMI counts per cell stratified by genotype (no pooling by individual).
def stratify_umi(counts, genotypes, gene, rsid):
  counts = pd.DataFrame(counts.loc[gene].transpose())
  counts.index = [k.split('.')[0] for k in counts.index]
  genotypes = genotypes[genotypes['ID'] == rsid].iloc[:,9:].transpose().astype(np.int32)
  if len(counts) == 0 or len(genotypes) == 0:
    raise ValueError
  merged = counts.merge(genotypes, how='left', left_index=True, right_index=True)
  merged.columns = ['count', 'genotype']
  return merged

def plot_umi_dist(counts, genotypes, ensembl, gene, rsid, **kwargs):
  if 'kind' not in kwargs:
    kwargs['kind'] = 'hist'
  plt.clf()
  plt.gcf().set_size_inches(6, 4)
  merged = stratify_umi(counts, genotypes, gene, rsid)
  if kwargs.get('kind', '') == 'hist':
    kwargs['bins'] = np.arange(merged['count'].max()).astype(np.float32)
    kwargs['histtype'] = 'step'
  for k, g in merged.groupby('genotype'):
    ax = g['count'].plot(**kwargs)
    ax.set_xlim(left=0)
  plt.title('{}, {}'.format(ensembl.loc[gene, 'symbol'], rsid))
  plt.xlabel('UMI count')
  plt.legend(labels=np.arange(3))
ZWIM7
plot_umi_dist(counts, genotypes, ensembl, 'ENSG00000214941', 'rs73276049')
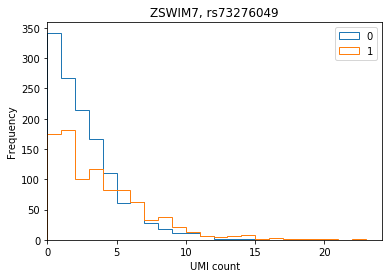
At this variant, there are only two YRI individuals with genotype 2, and they are not among the individuals assayed.
genotypes[genotypes['ID'] == 'rs73276049'].iloc[0,9:].transpose().astype(np.int32).value_counts()
0    83
  1    34
  2     2
  Name: 2295561, dtype: int64
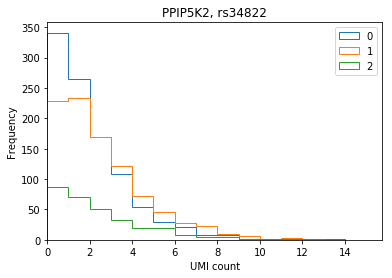
PPIP5K2
plot_umi_dist(counts, genotypes, ensembl, 'ENSG00000145725', 'rs34822')
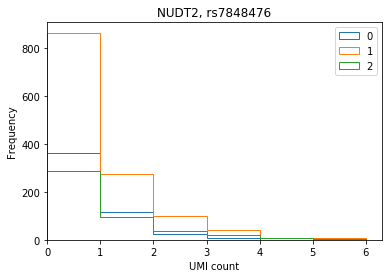
NUDT2
plot_umi_dist(counts, genotypes, ensembl, 'ENSG00000164978', 'rs7848476')
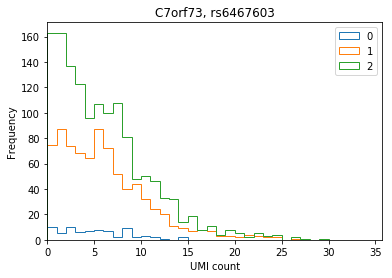
C7orf73
plot_umi_dist(counts, genotypes, ensembl, 'ENSG00000243317', 'rs6467603')
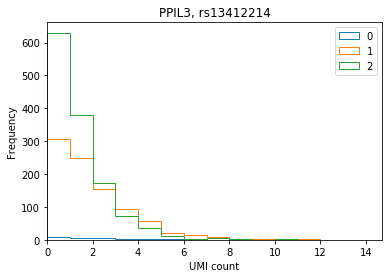
PPIL3
plot_umi_dist(counts, genotypes, ensembl, 'ENSG00000240344', 'rs13412214')