Investigate intensity against some cell shape metrics
Joyce Hsiao
Last updated: 2017-12-11
Code version: a2196b6
Introduction/background
Here we investigated the relationship between intensity measures and nuclei shape measures. We particularly focus on DAPI intensitiy measures which are computed solely from the pixels enclosed in the nuclei boundaries.
Results:
DAPI intensities are skewed. This is confirmed in the visual inspectation of the images. We see some spotty pixels with much higher intensities with the rest of the pixels - or a spike in intensities so to speak.
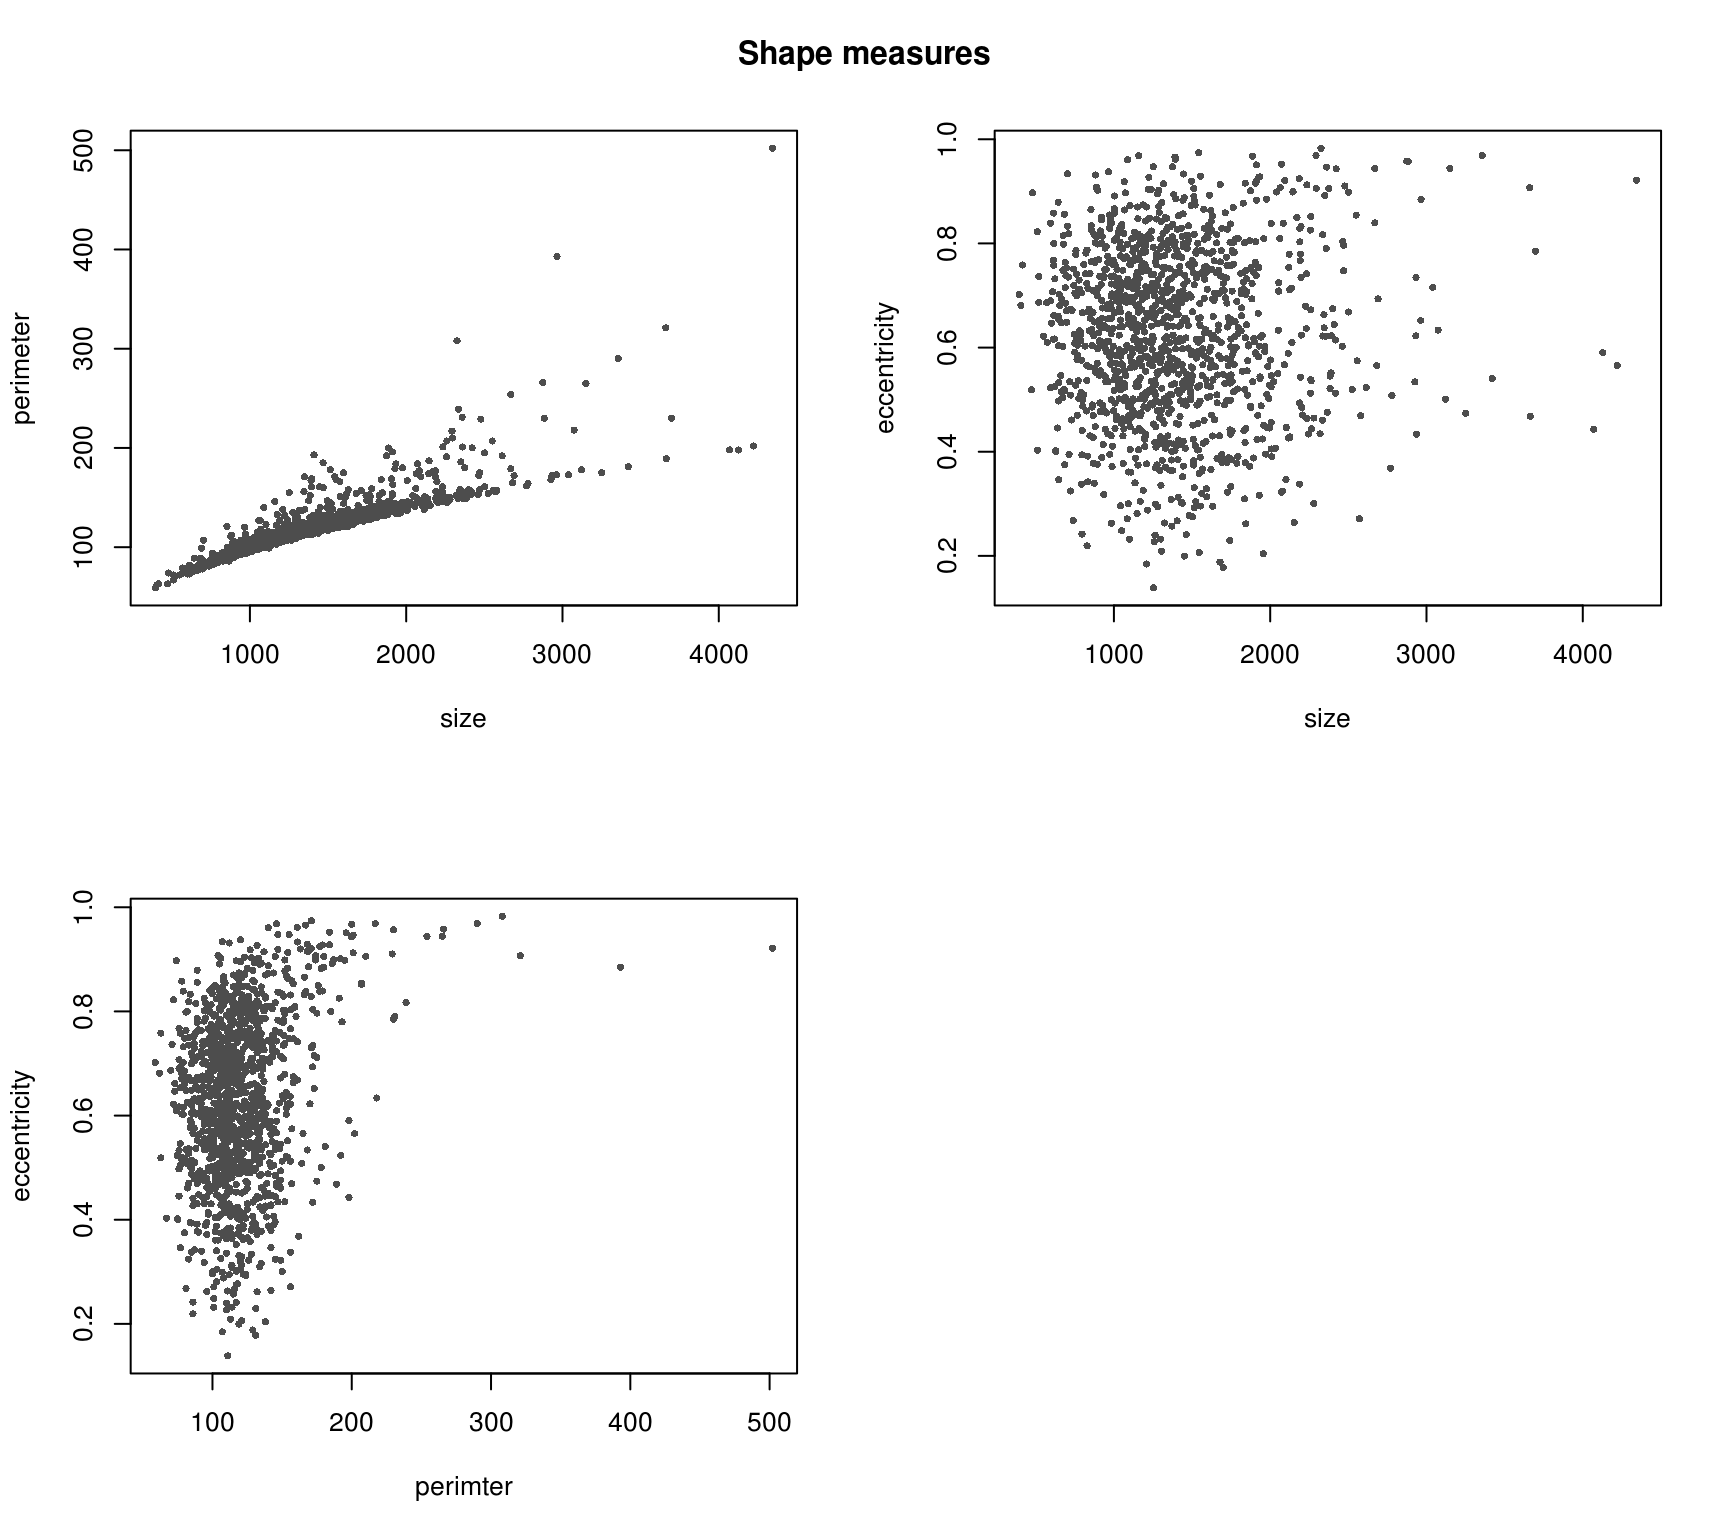
Nucleus size is highly correlated with perimeter as expected. However, note several outlier cases in which several cells with the same size were detected to have drastically different perimeter. Need to pull these cases and see what’s up!
Nucleus size is not correlated with eccentricty and neither is perimeter as expected.
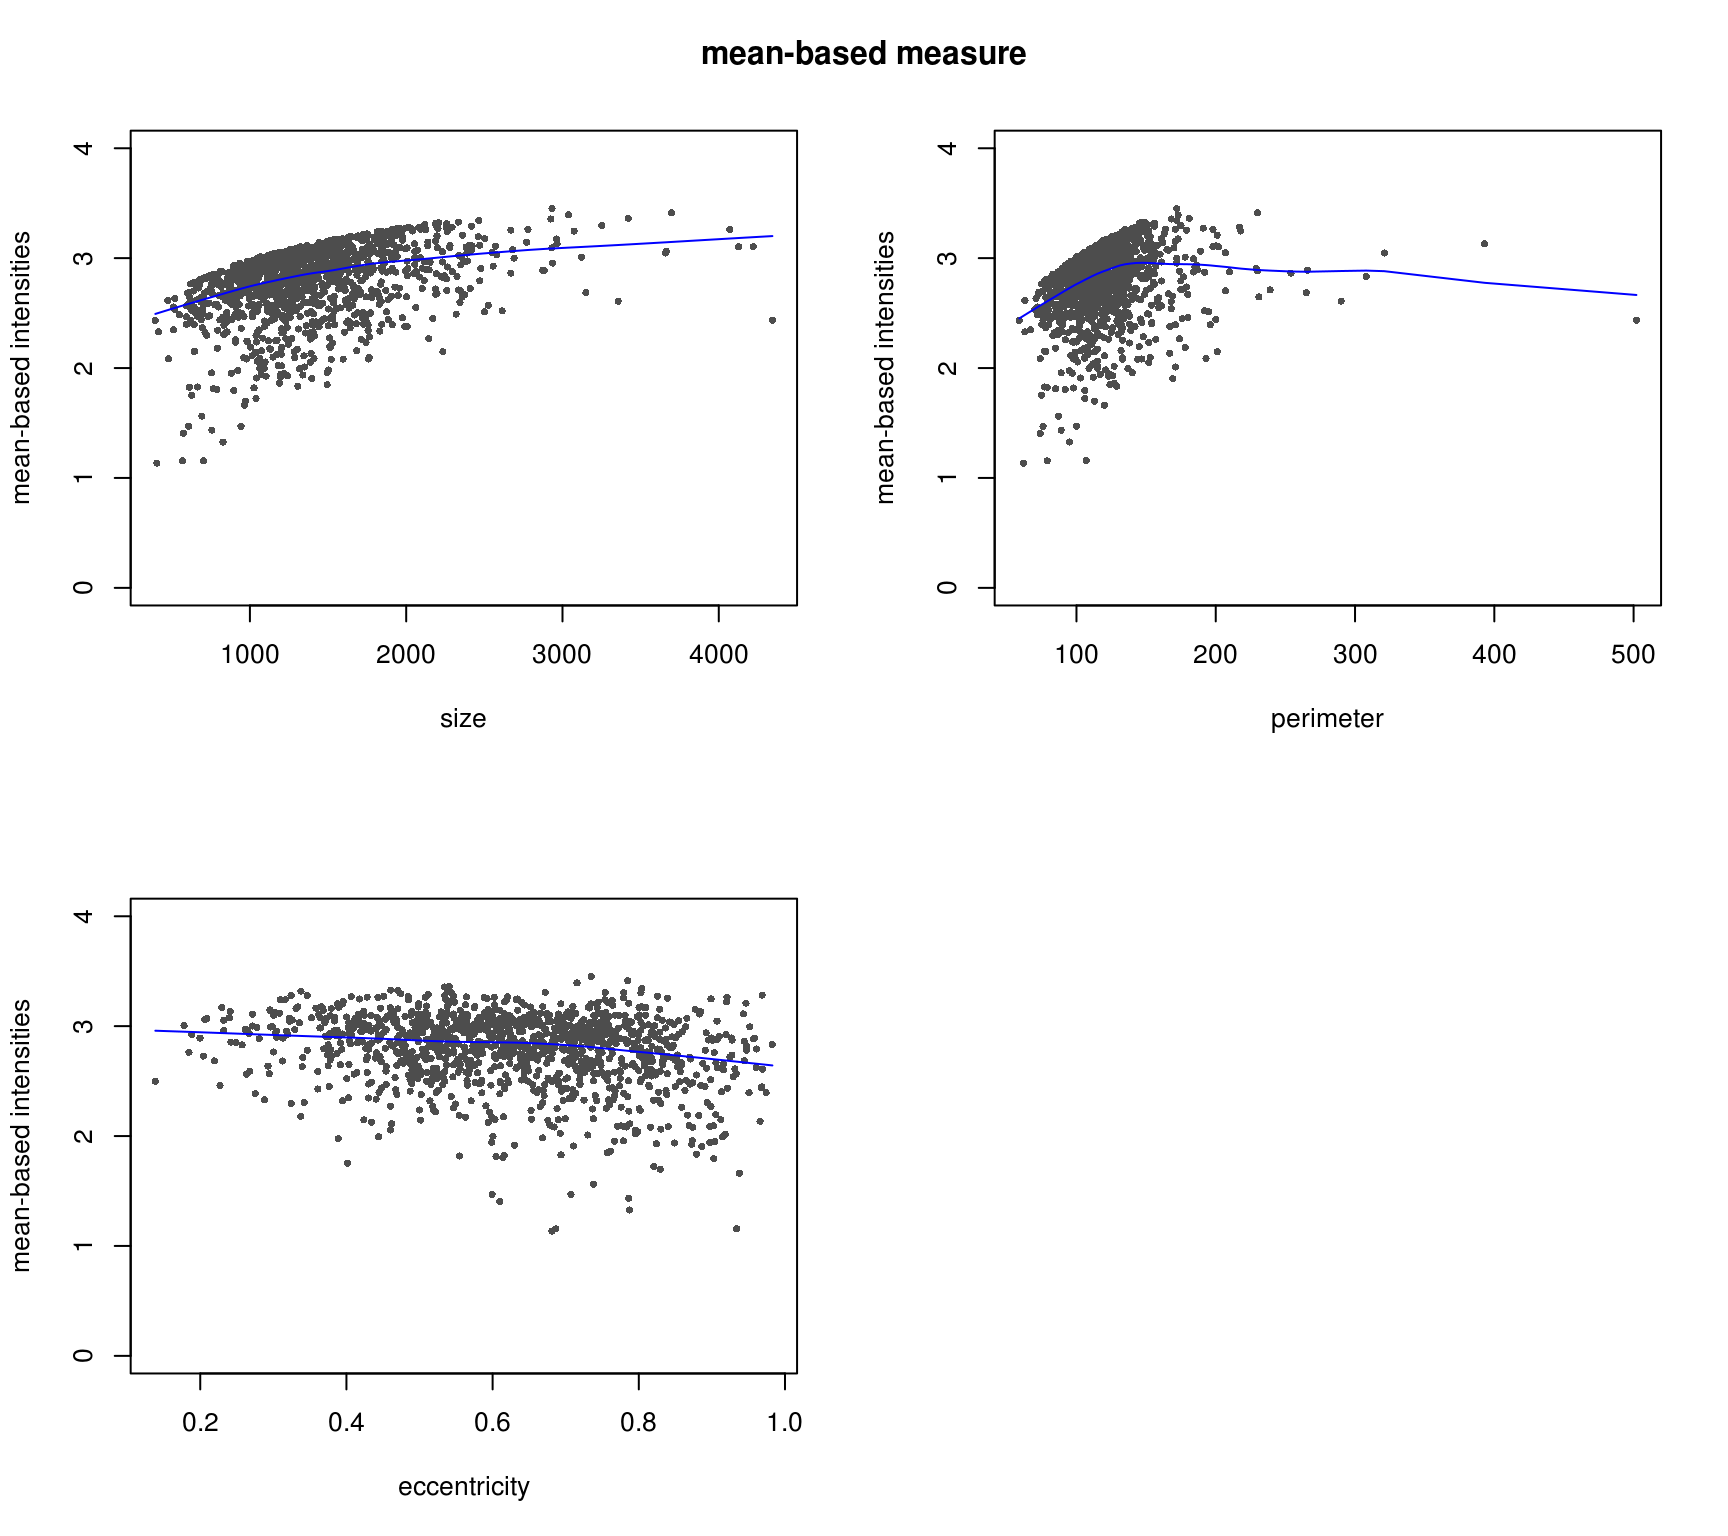
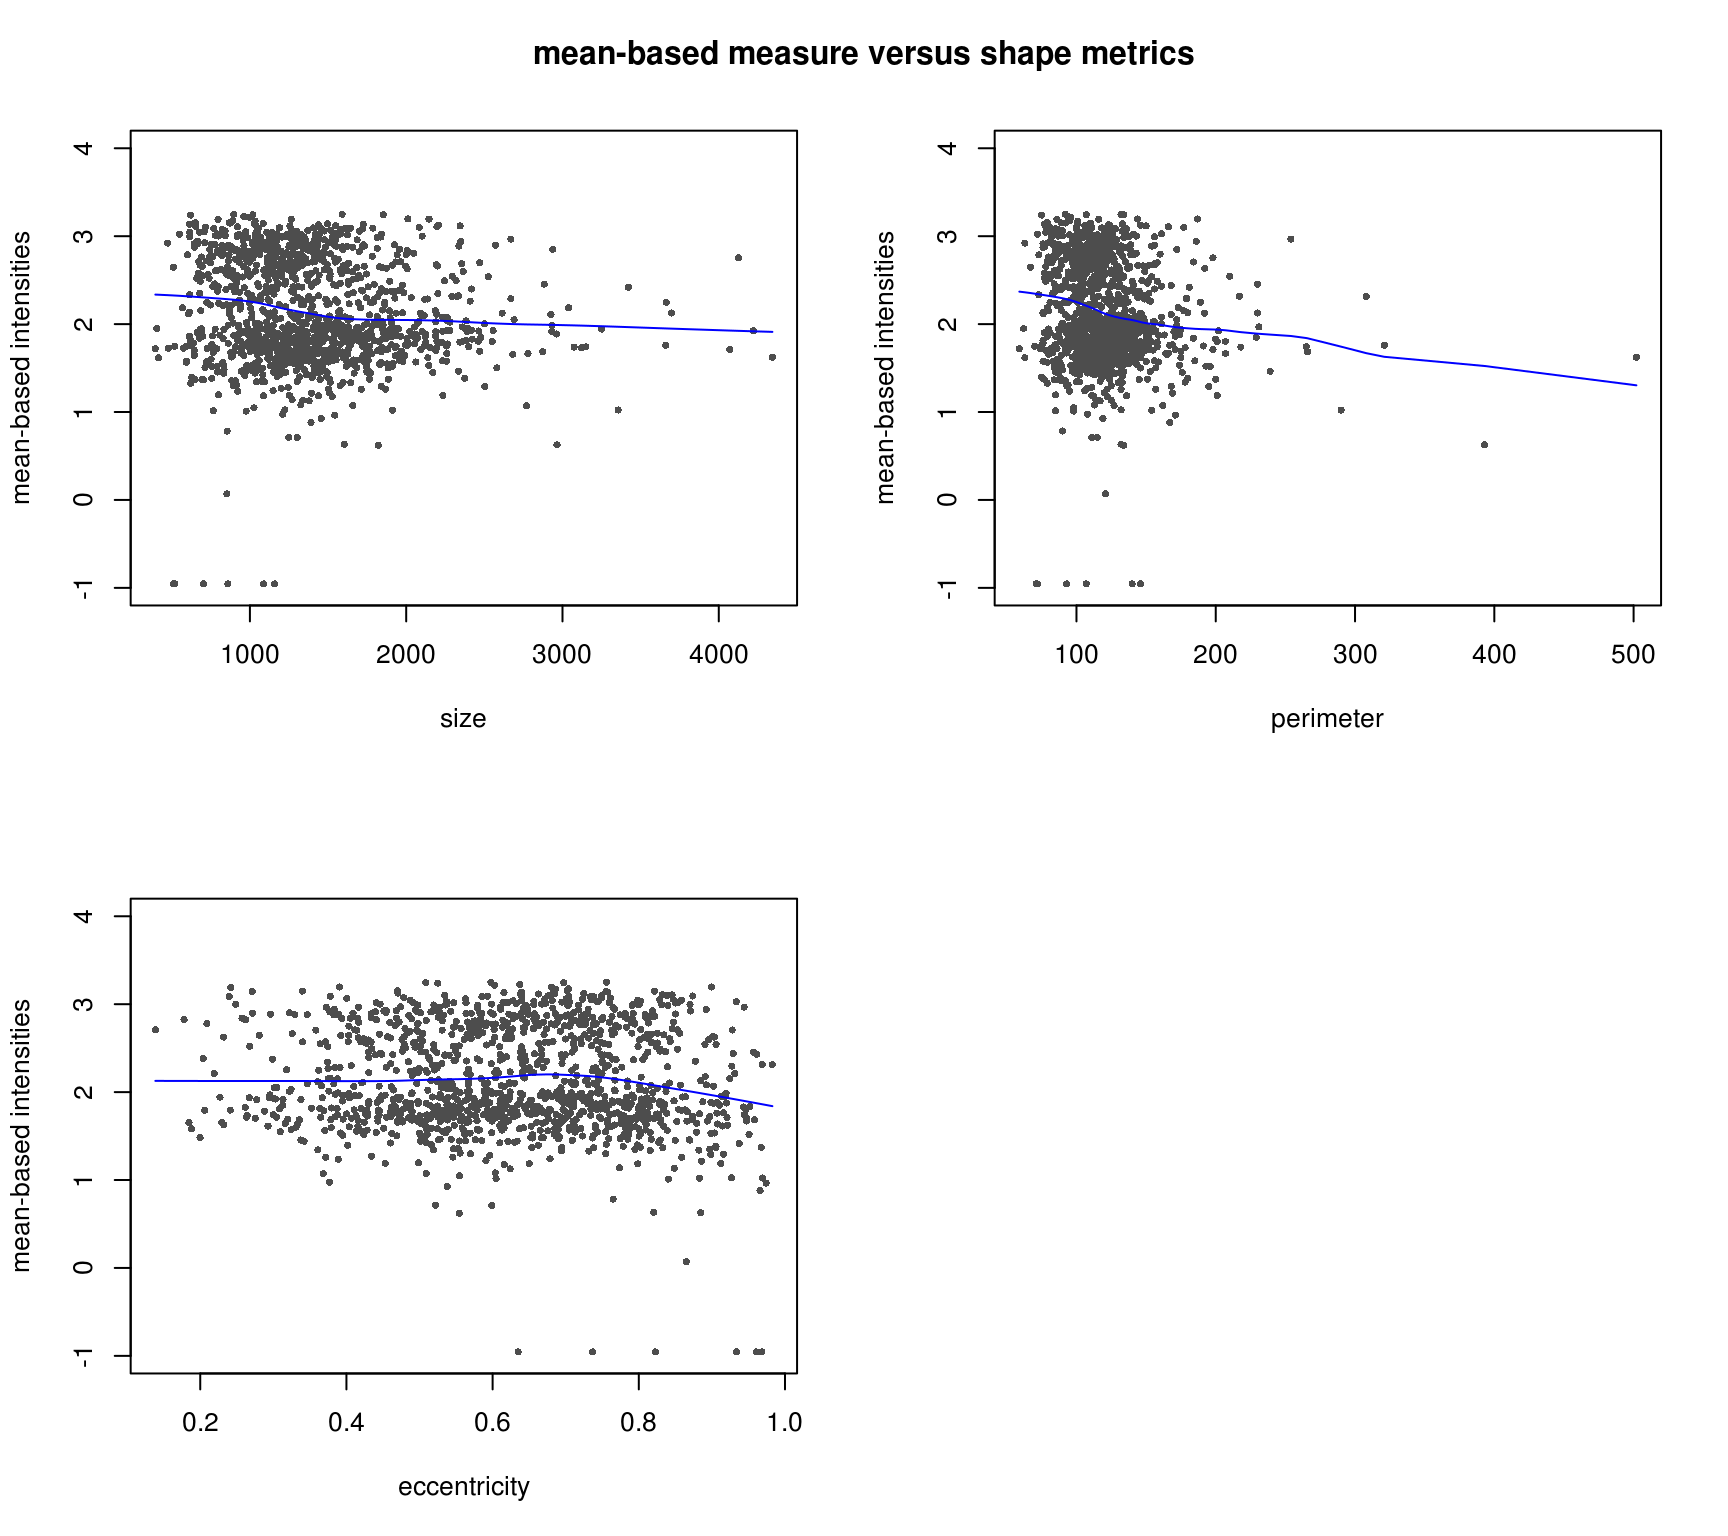
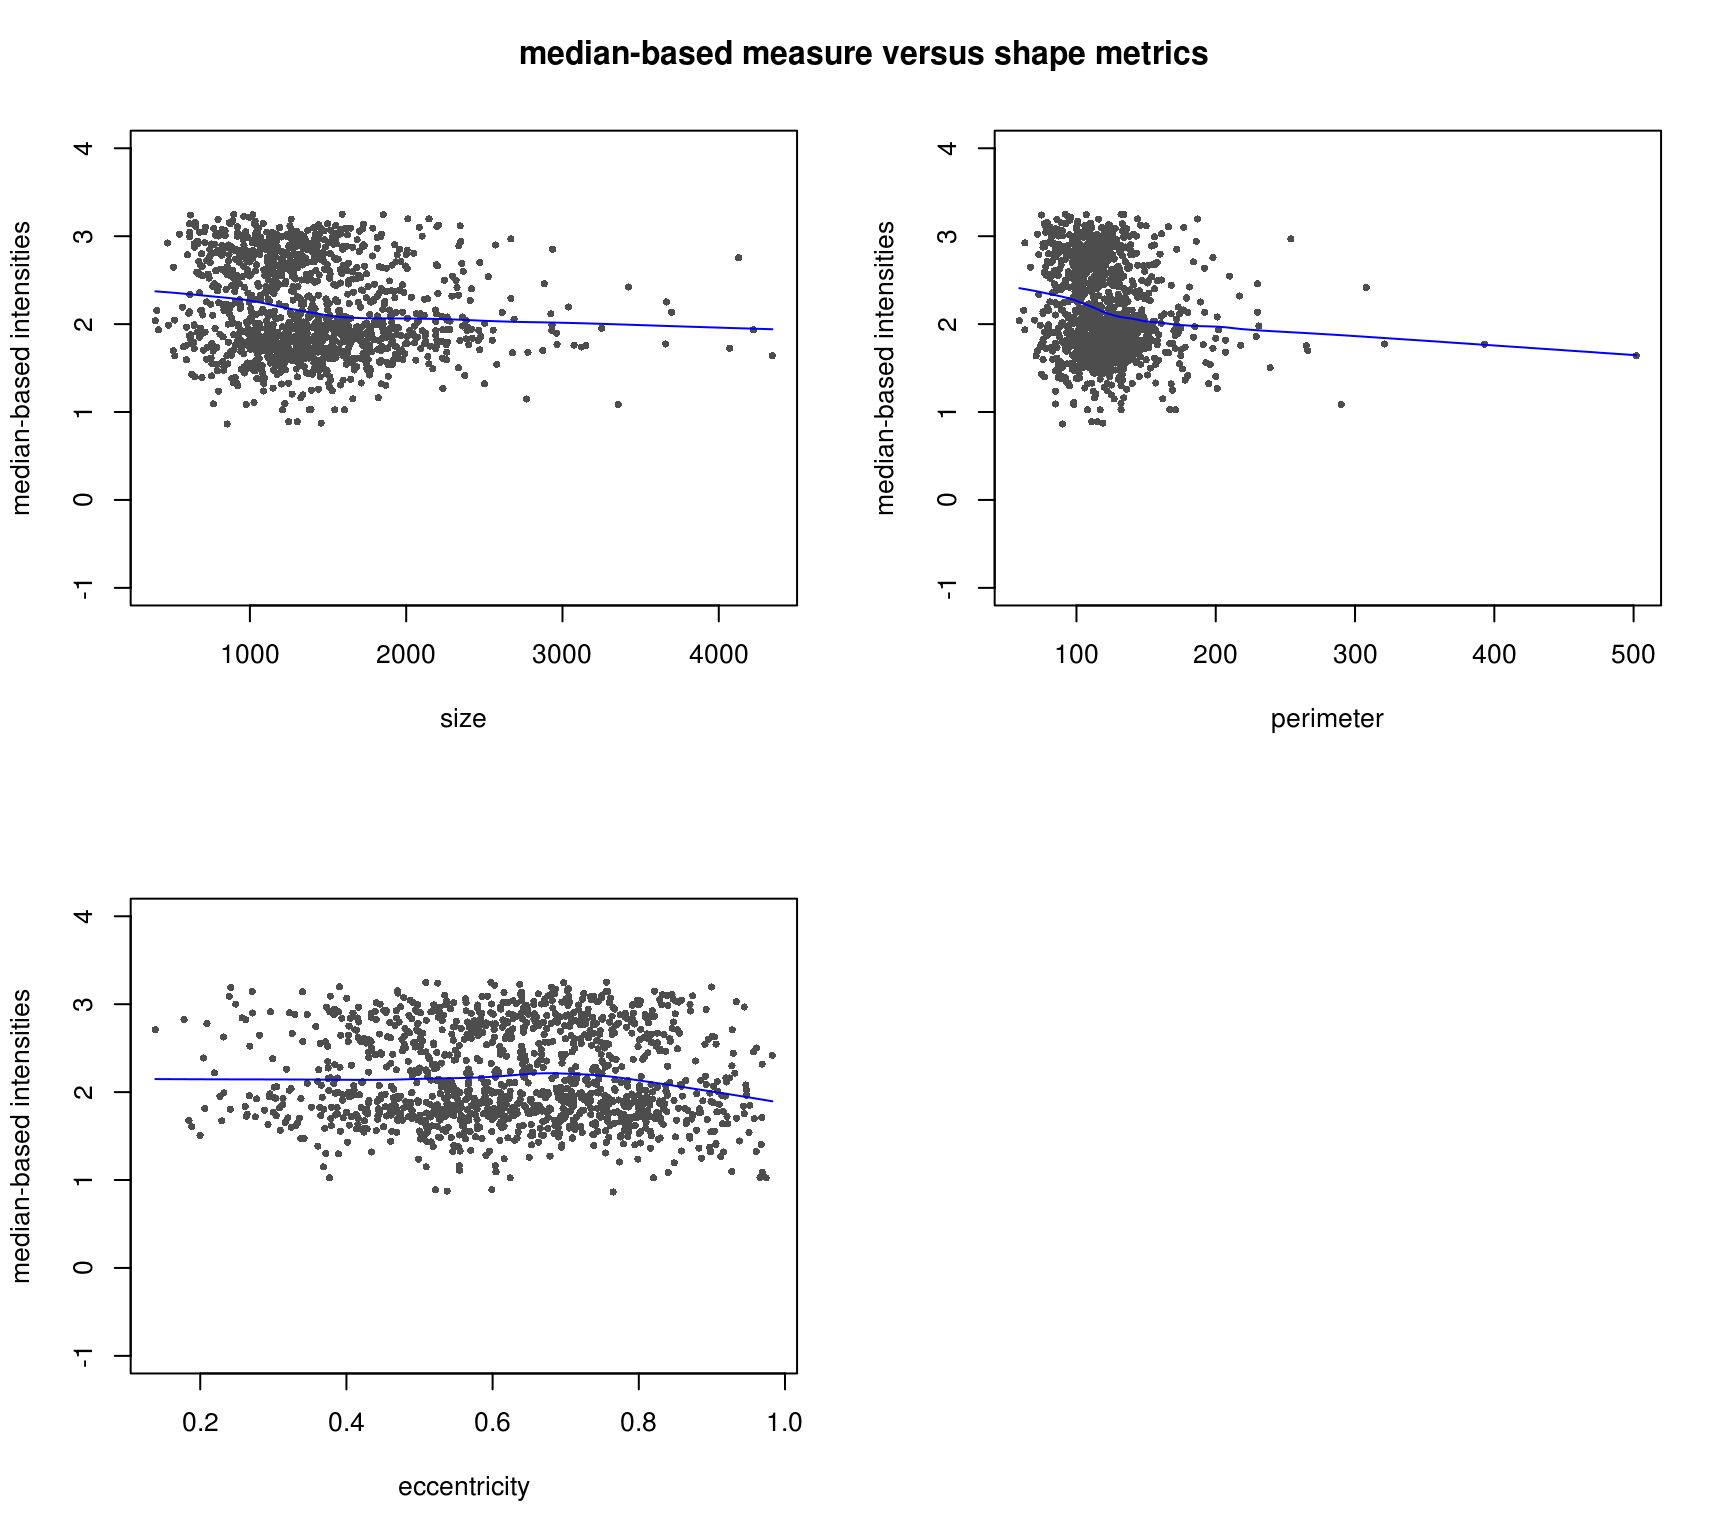
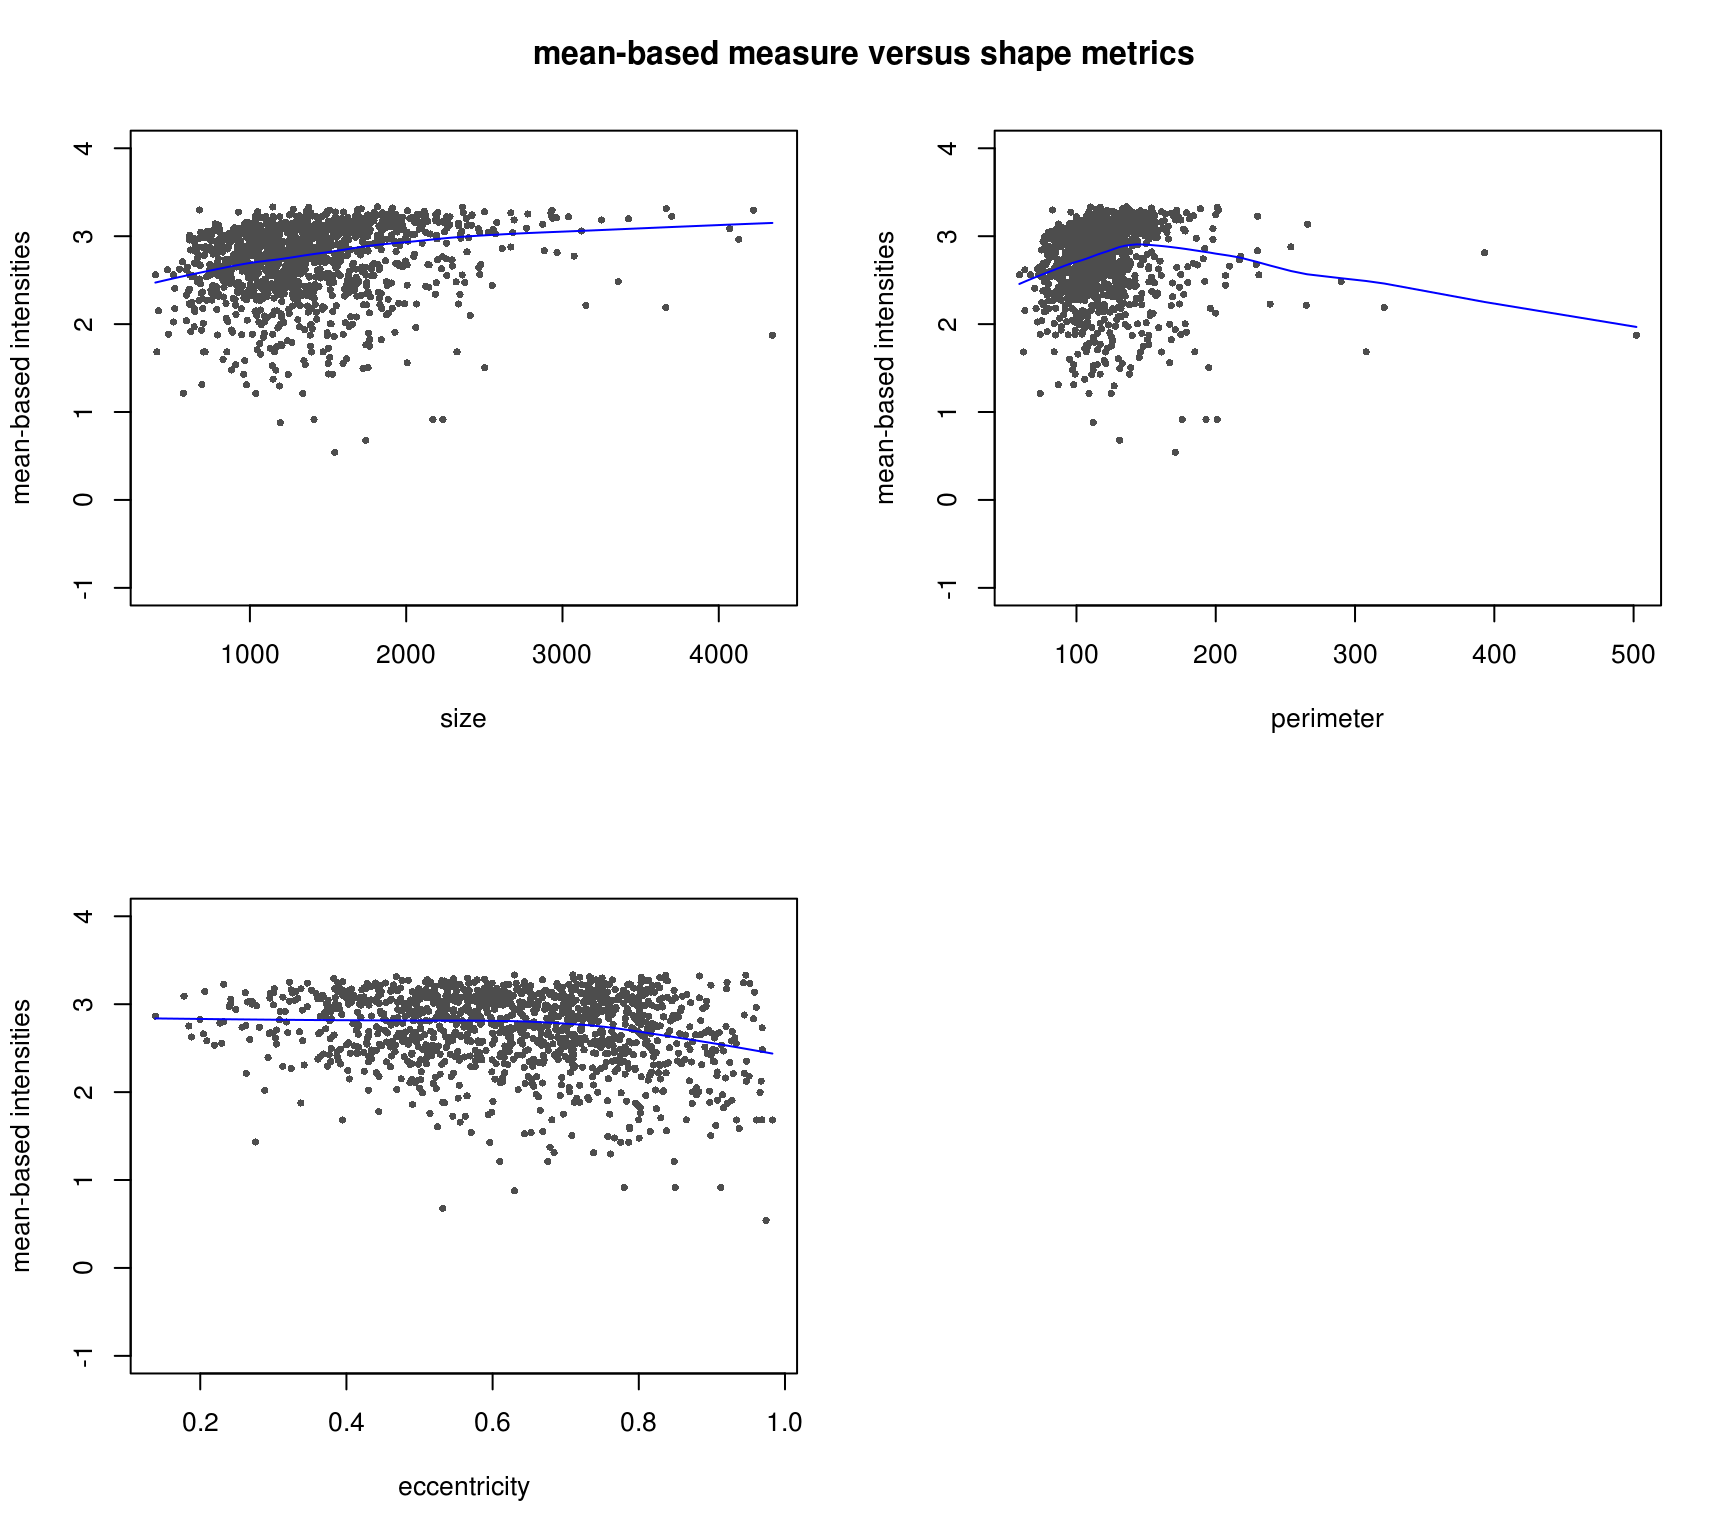
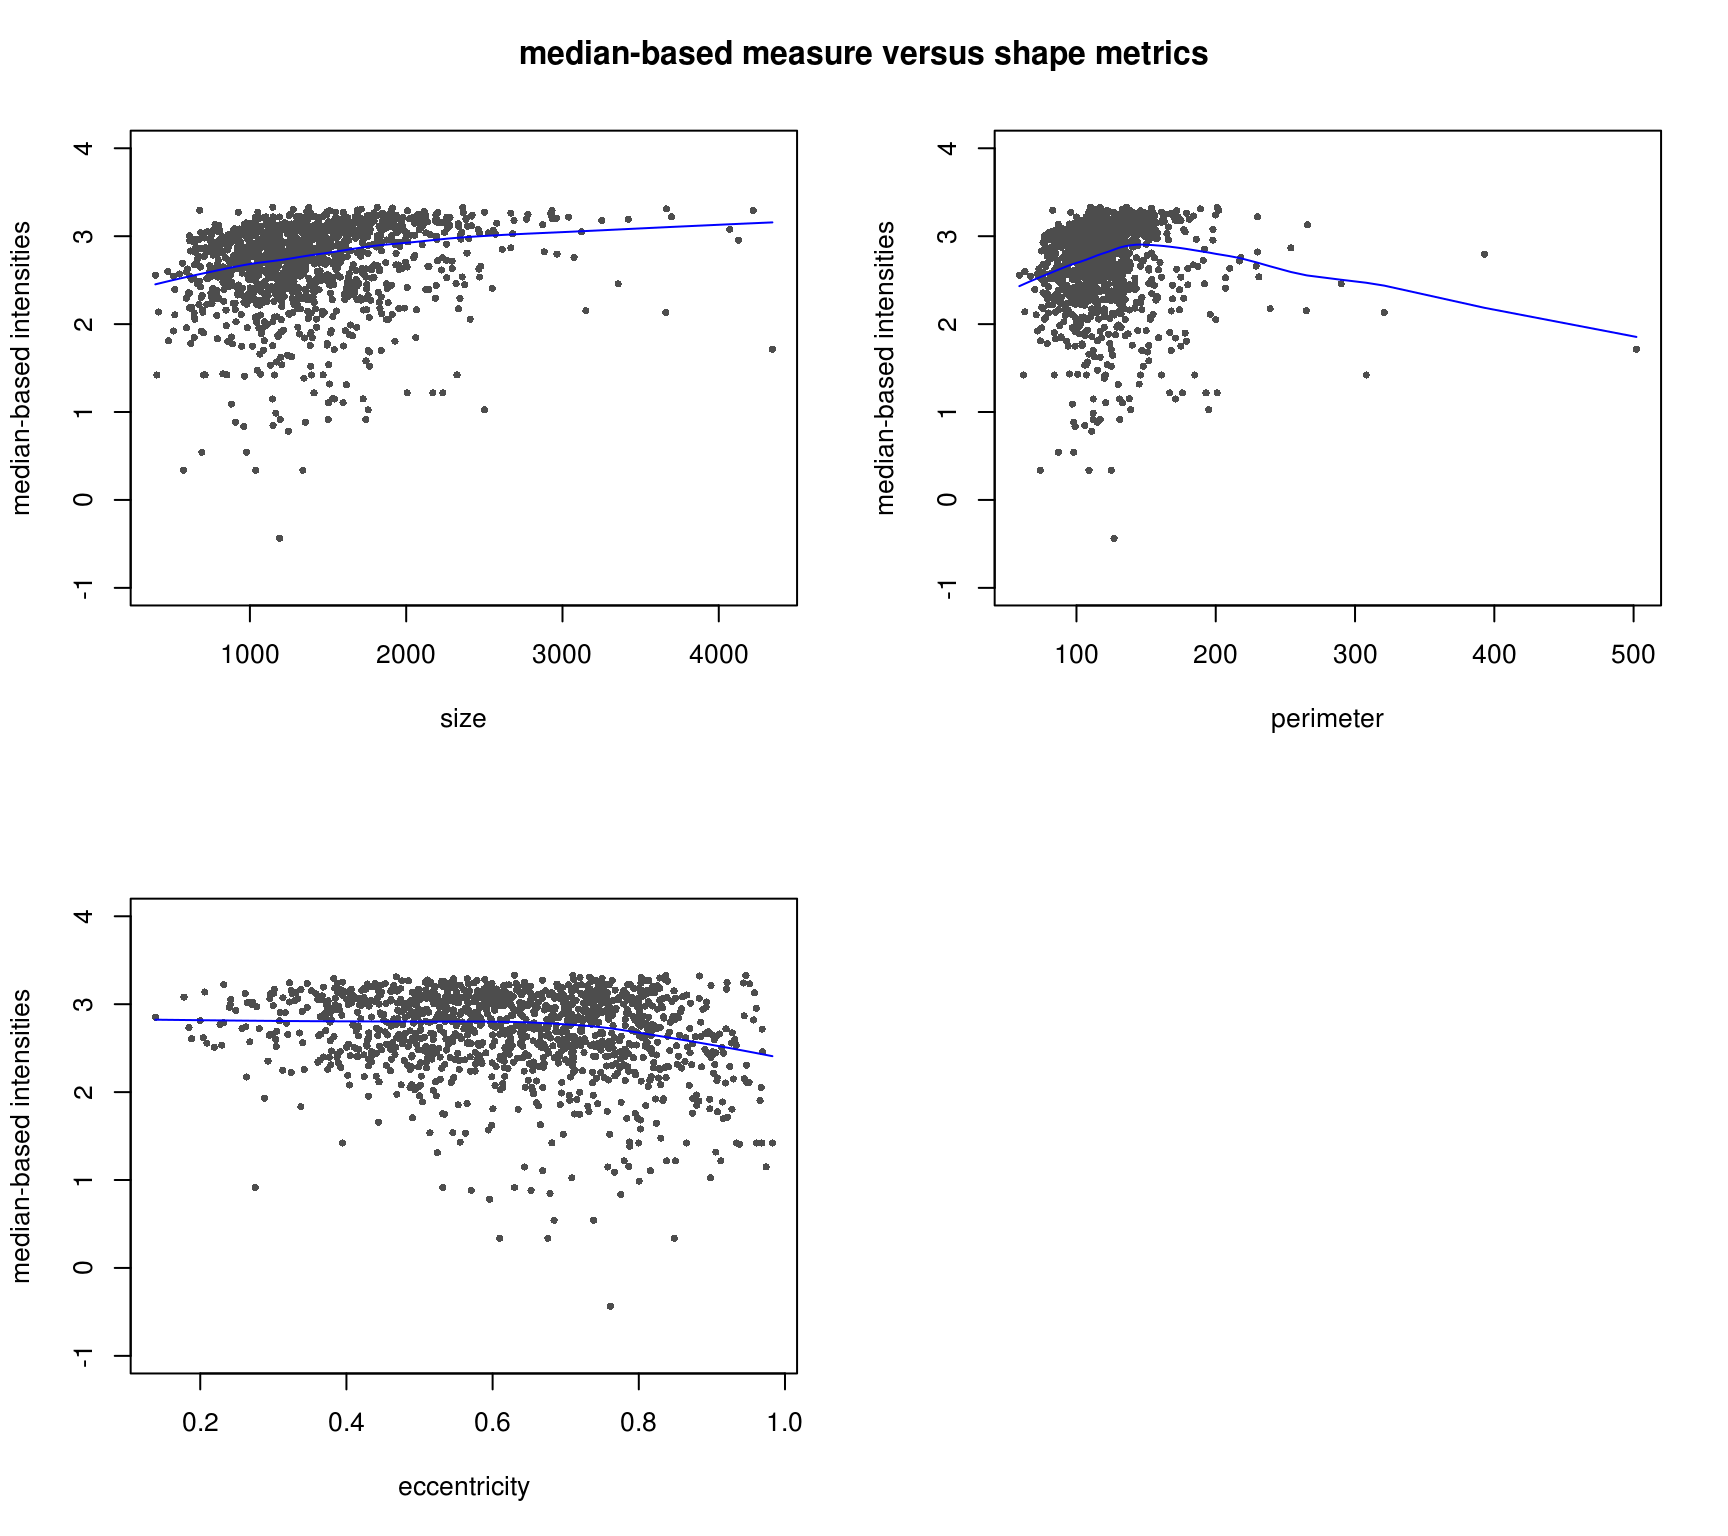
DAPI median-based measures (background median corrected) correlate better with cell shape measures - the patterns make more sense. Notatbly higher correlation between median-based measures and cell shape measures compared to mean-based measures.
Consider the two intensity channels RFP and GFP. It seems that the GFP intensities are somehow correlated with the nucleus size, but the RFP does not correlate with these cell shape measures at all.
Next step:
- Compute cell size based on each channel…
Load data
Import combined intensity data (see combine-intensity-data.R).
ints <- readRDS(file="/project2/gilad/joycehsiao/fucci-seq/data/intensity.rds")\(~\)
\(~\)
DAPI and shape
\(~\)
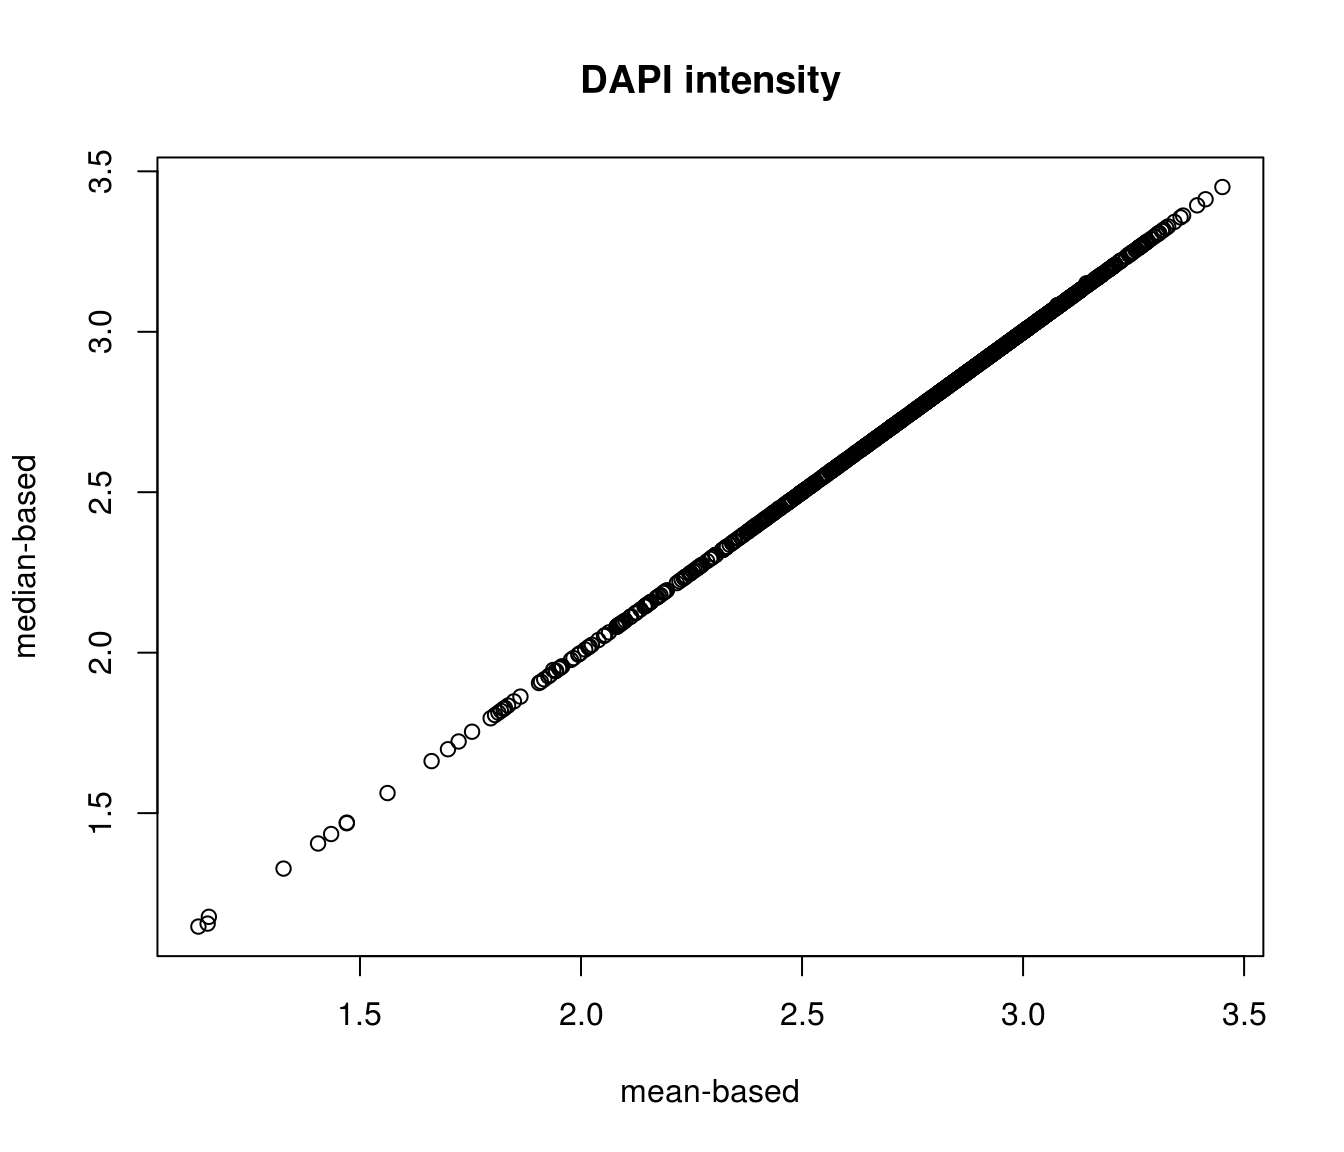
Compare DAPI metrics after background mean correction versus after background median correction.
\(~\)
Various shape metrics

RFP and shape
\(~\)
GFP and shape
Session information
sessionInfo()R version 3.4.1 (2017-06-30)
Platform: x86_64-pc-linux-gnu (64-bit)
Running under: Scientific Linux 7.2 (Nitrogen)
Matrix products: default
BLAS: /home/joycehsiao/miniconda3/envs/fucci-seq/lib/R/lib/libRblas.so
LAPACK: /home/joycehsiao/miniconda3/envs/fucci-seq/lib/R/lib/libRlapack.so
locale:
[1] LC_CTYPE=en_US.UTF-8 LC_NUMERIC=C
[3] LC_TIME=en_US.UTF-8 LC_COLLATE=en_US.UTF-8
[5] LC_MONETARY=en_US.UTF-8 LC_MESSAGES=en_US.UTF-8
[7] LC_PAPER=en_US.UTF-8 LC_NAME=C
[9] LC_ADDRESS=C LC_TELEPHONE=C
[11] LC_MEASUREMENT=en_US.UTF-8 LC_IDENTIFICATION=C
attached base packages:
[1] parallel stats graphics grDevices utils datasets methods
[8] base
other attached packages:
[1] Biobase_2.38.0 BiocGenerics_0.24.0 RColorBrewer_1.1-2
[4] wesanderson_0.3.2 cowplot_0.8.0 ggplot2_2.2.1
[7] dplyr_0.7.0 data.table_1.10.4
loaded via a namespace (and not attached):
[1] Rcpp_0.12.14 knitr_1.16 magrittr_1.5 munsell_0.4.3
[5] colorspace_1.3-2 R6_2.2.0 rlang_0.1.2 stringr_1.2.0
[9] plyr_1.8.4 tools_3.4.1 grid_3.4.1 gtable_0.2.0
[13] git2r_0.19.0 htmltools_0.3.6 lazyeval_0.2.0 yaml_2.1.14
[17] rprojroot_1.2 digest_0.6.12 assertthat_0.1 tibble_1.3.3
[21] glue_1.1.1 evaluate_0.10.1 rmarkdown_1.6 stringi_1.1.2
[25] compiler_3.4.1 scales_0.4.1 backports_1.0.5 This R Markdown site was created with workflowr