Intensities by individual ID and plate
Joyce Hsiao
Last updated: 2017-12-11
Code version: 960abf5
Summary
Previously, we saw a wide range of variability across plates in DAPI intensities, and to a lesser extent, in Green and Red intensities. Here we look at variation between individuals and see that there’s significantly smaller variation between individuals in all three measurements. In addition, in the across-plate results, the DAPI distributions have similar shape across plates and a possible mean-shift between distributions. While, the shape of the green/red distributions are not consistent across plates, possibly reflecting differences in proprotion of samples expressing red/green fluorescent proteins.
For normalization approach, we can use mean correction approaches for DAPI. While, for Green/Red, it’s less obvious what would be a good approach. Let me try qsmooth and see….
Load data
Warning: Installed Rcpp (0.12.14) different from Rcpp used to build dplyr (0.12.10).
Please reinstall dplyr to avoid random crashes or undefined behavior.
Attaching package: 'dplyr'The following objects are masked from 'package:data.table':
between, first, lastThe following objects are masked from 'package:stats':
filter, lagThe following objects are masked from 'package:base':
intersect, setdiff, setequal, union
Attaching package: 'cowplot'The following object is masked from 'package:ggplot2':
ggsaveLoading required package: BiocGenericsLoading required package: parallel
Attaching package: 'BiocGenerics'The following objects are masked from 'package:parallel':
clusterApply, clusterApplyLB, clusterCall, clusterEvalQ,
clusterExport, clusterMap, parApply, parCapply, parLapply,
parLapplyLB, parRapply, parSapply, parSapplyLBThe following objects are masked from 'package:dplyr':
combine, intersect, setdiff, unionThe following objects are masked from 'package:stats':
IQR, mad, sd, var, xtabsThe following objects are masked from 'package:base':
anyDuplicated, append, as.data.frame, cbind, colMeans,
colnames, colSums, do.call, duplicated, eval, evalq, Filter,
Find, get, grep, grepl, intersect, is.unsorted, lapply,
lengths, Map, mapply, match, mget, order, paste, pmax,
pmax.int, pmin, pmin.int, Position, rank, rbind, Reduce,
rowMeans, rownames, rowSums, sapply, setdiff, sort, table,
tapply, union, unique, unsplit, which, which.max, which.minWelcome to Bioconductor
Vignettes contain introductory material; view with
'browseVignettes()'. To cite Bioconductor, see
'citation("Biobase")', and for packages 'citation("pkgname")'.ints <- readRDS(file="/project2/gilad/joycehsiao/fucci-seq/data/intensity.rds")By plate
\(~\)
ggplot(ints, aes(x=gfp.mean.log10sum,col = as.factor(plate))) +
  geom_density(alpha = .5, cex = .7) +
  labs(title = "Green (log10 pixel sum) by plate",
x="Green channel log10 pixel sum", y = "Density") + theme_gray() 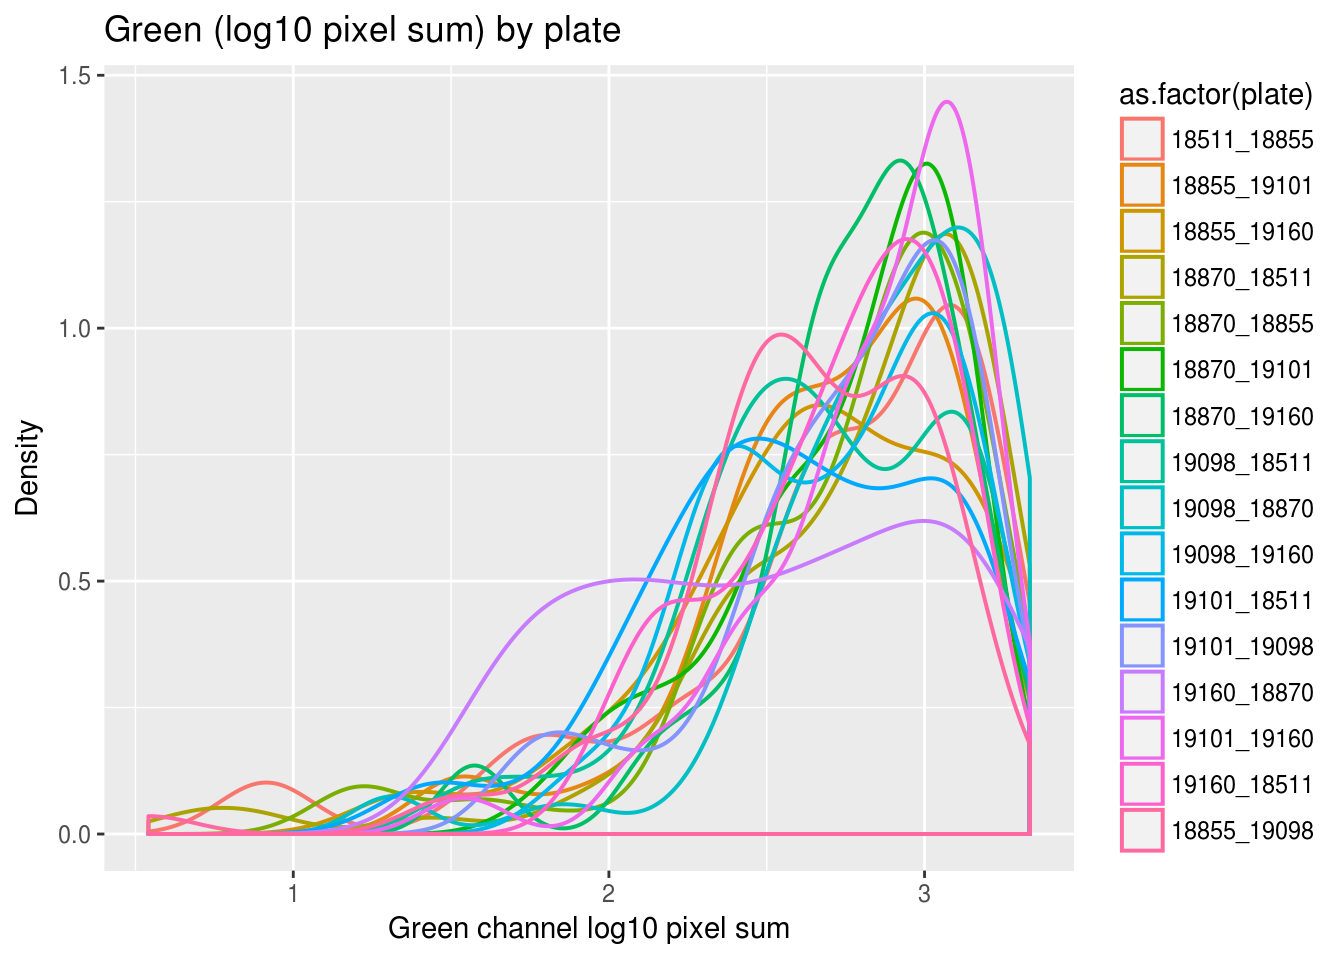
ggplot(ints, aes(x=rfp.mean.log10sum,col = as.factor(plate))) +
  geom_density(alpha = .5, cex = .7) +
  labs(title = "Red (log10 pixel sum) by plate",
x="Red channel log10 pixel sum", y = "Density") + theme_gray() 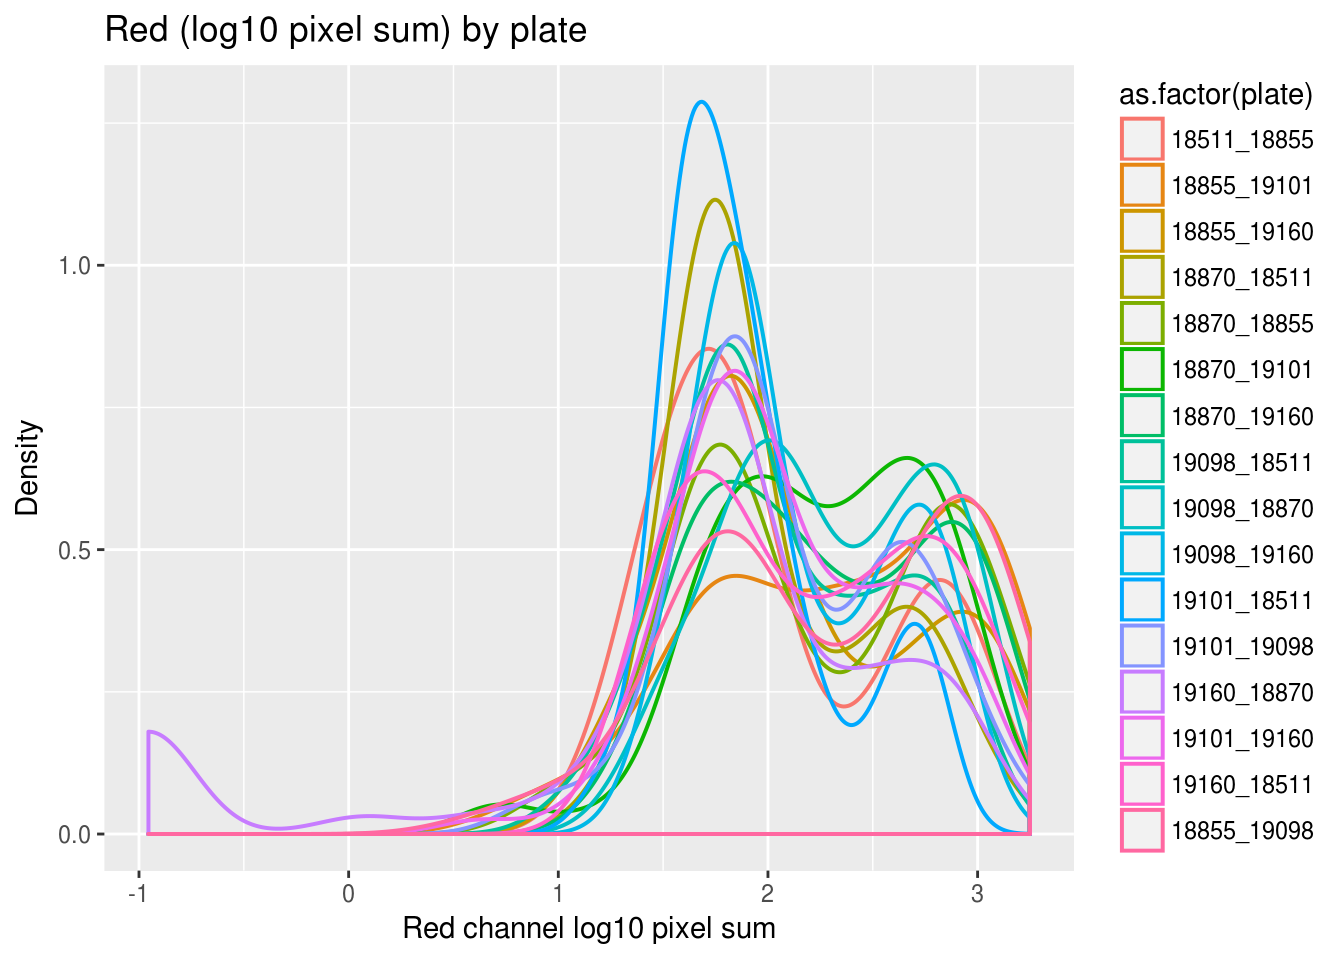
ggplot(ints, aes(x=dapi.mean.log10sum,col = as.factor(plate))) +
  geom_density(alpha = .5, cex = .7) +
  labs(title = "DAPI (log10 pixel sum) by plate",
x="DAPI channel log10 pixel sum", y = "Density") + theme_gray() 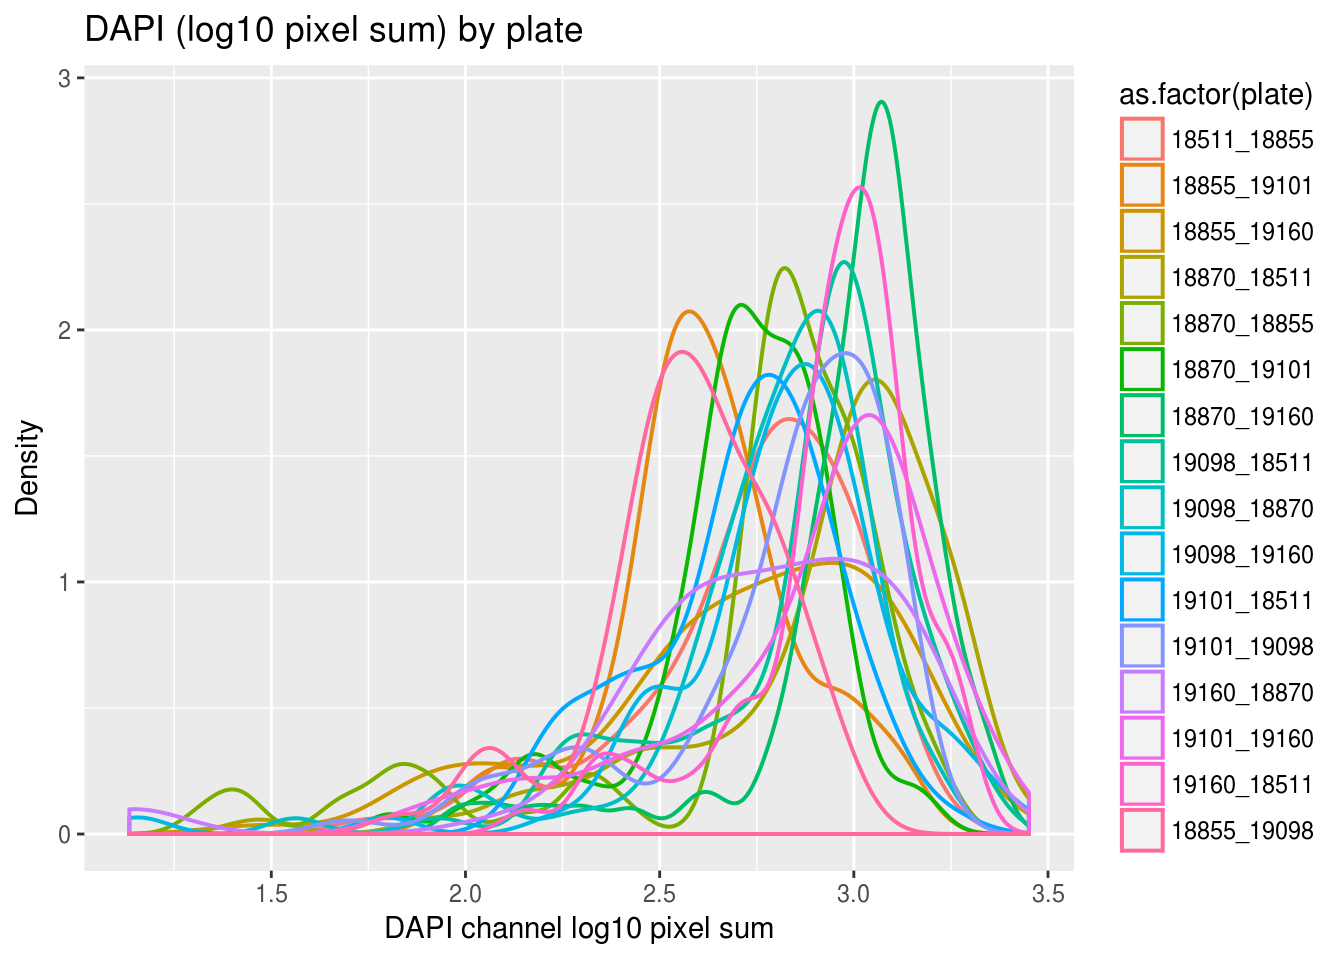
By individual
\(~\)
ggplot(ints, aes(x=gfp.mean.log10sum,col = as.factor(chip_id))) +
  geom_density(alpha = .5, cex = .7) +
  labs(title = "Green (log10 pixel sum) by individual",
x="Green channel log10 pixel sum", y = "Density") + theme_gray() 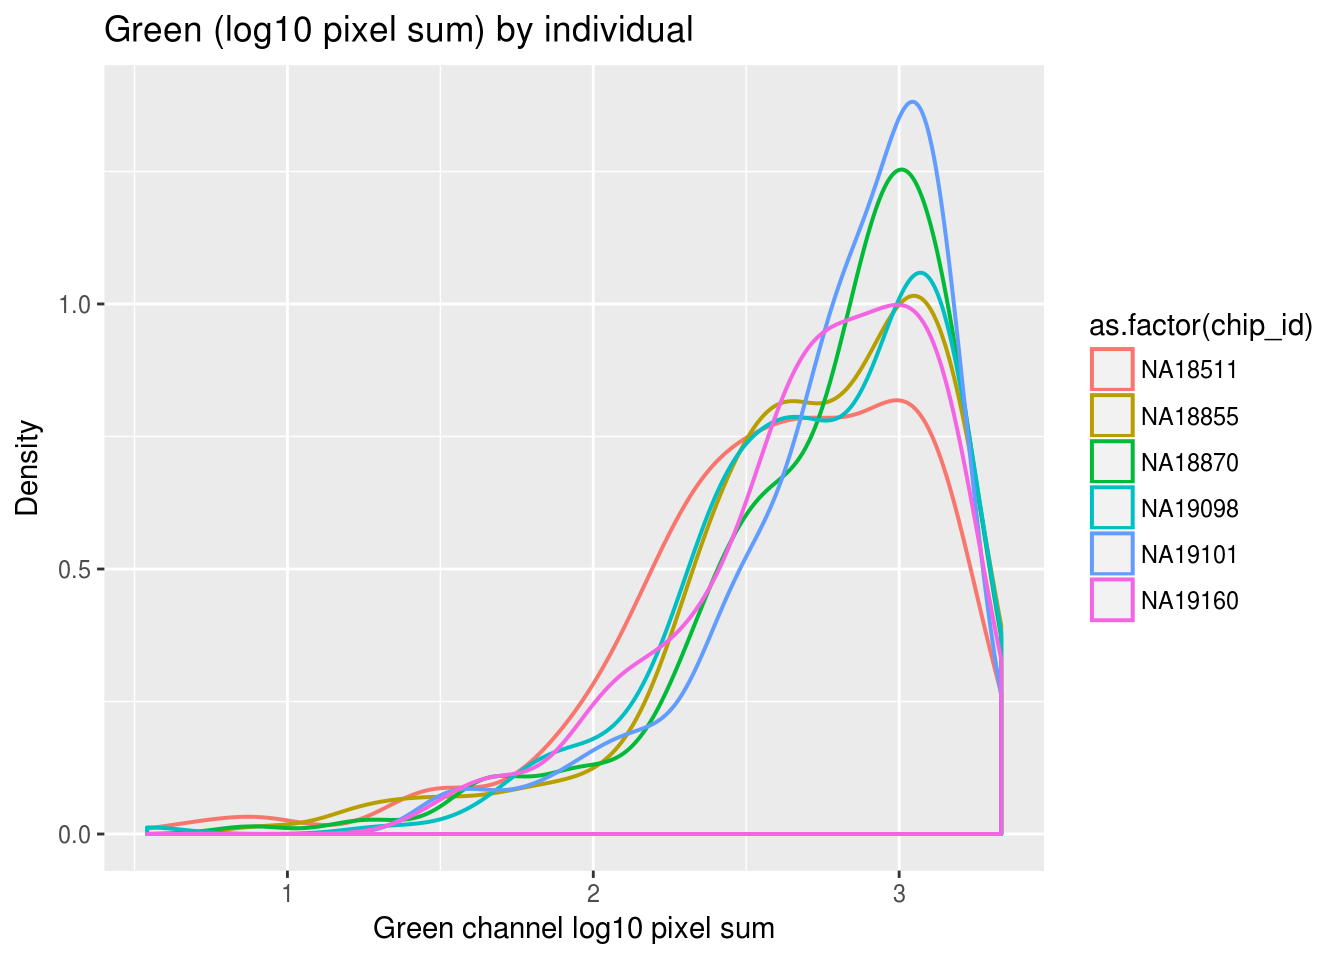
ggplot(ints, aes(x=rfp.mean.log10sum,col = as.factor(chip_id))) +
  geom_density(alpha = .5, cex = .7) +
  labs(title = "Red (log10 pixel sum) by individual",
x="Red channel log10 pixel sum", y = "Density") + theme_gray() 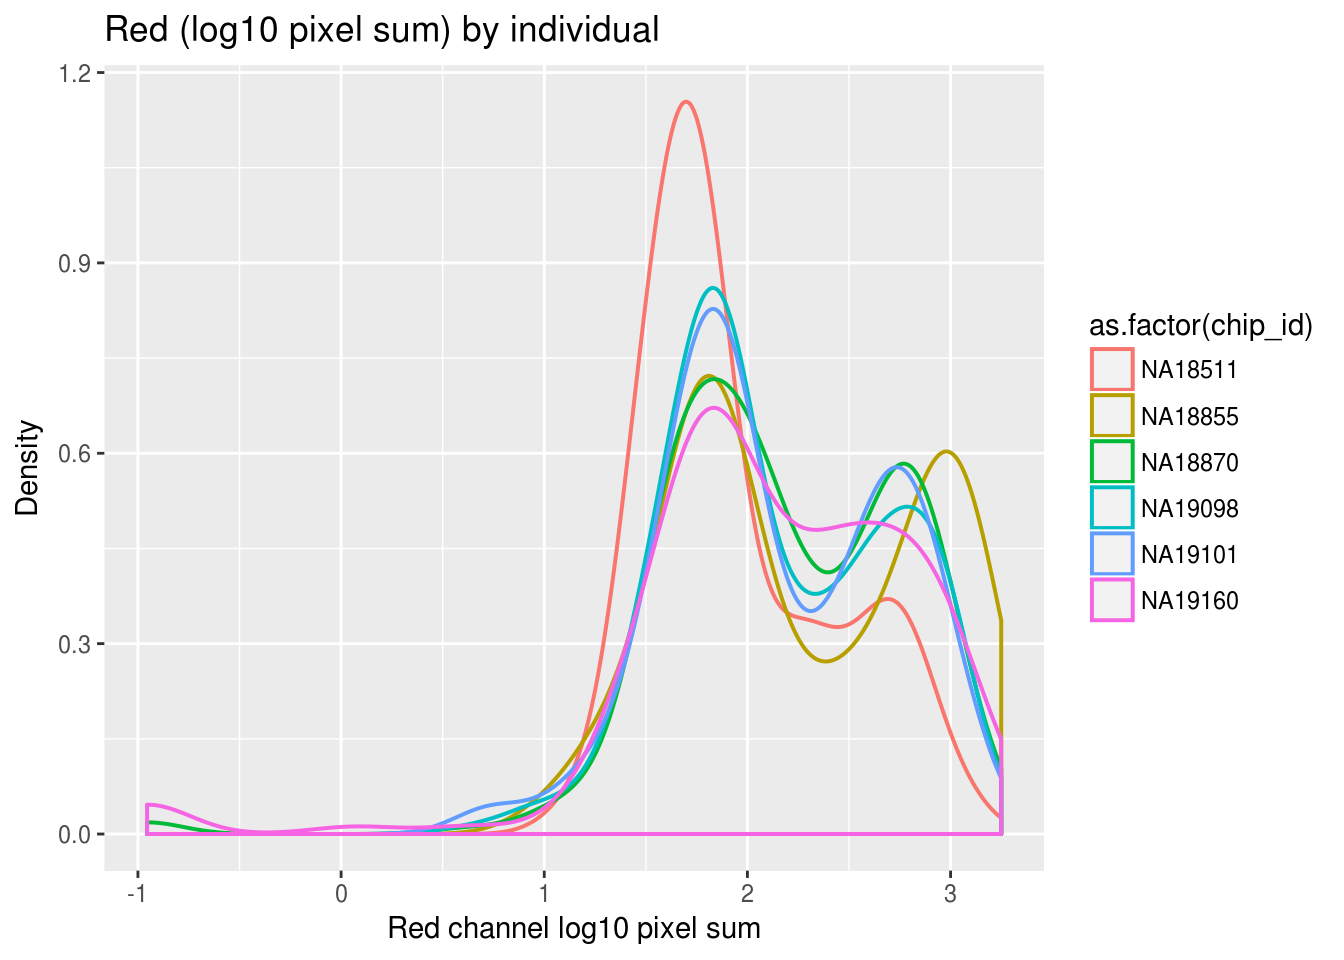
ggplot(ints, aes(x=dapi.mean.log10sum,col = as.factor(chip_id))) +
  geom_density(alpha = .5, cex = .7) +
  labs(title = "DAPI (log10 pixel sum) by individual",
x="DAPI channel log10 pixel sum", y = "Density") + theme_gray() 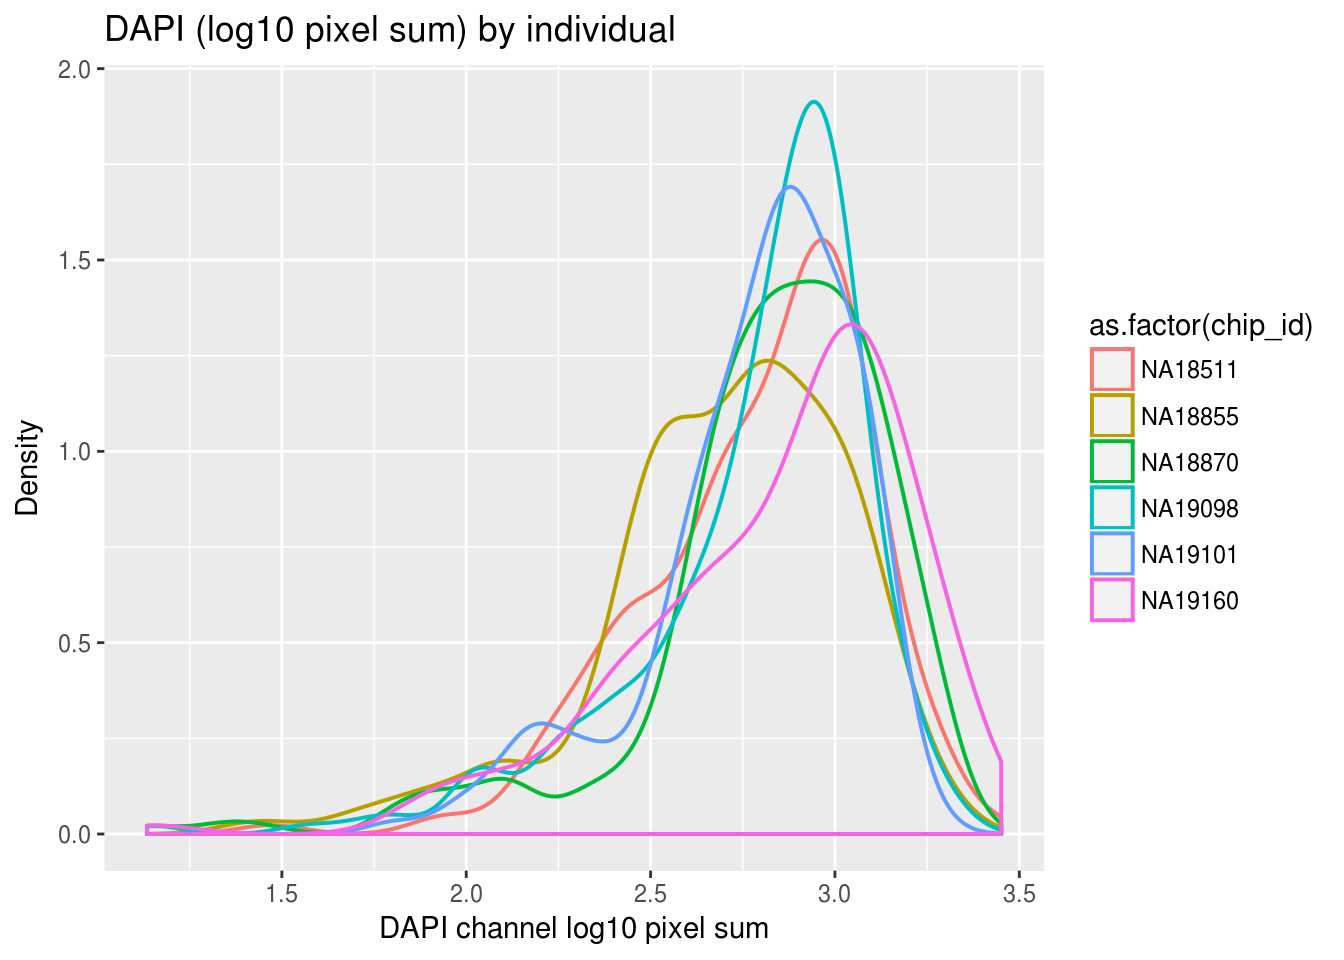
Session information
R version 3.4.1 (2017-06-30)
Platform: x86_64-pc-linux-gnu (64-bit)
Running under: Scientific Linux 7.2 (Nitrogen)

Matrix products: default
BLAS: /home/joycehsiao/miniconda3/envs/fucci-seq/lib/R/lib/libRblas.so
LAPACK: /home/joycehsiao/miniconda3/envs/fucci-seq/lib/R/lib/libRlapack.so

locale:
 [1] LC_CTYPE=en_US.UTF-8       LC_NUMERIC=C
 [3] LC_TIME=en_US.UTF-8        LC_COLLATE=en_US.UTF-8
 [5] LC_MONETARY=en_US.UTF-8    LC_MESSAGES=en_US.UTF-8
 [7] LC_PAPER=en_US.UTF-8       LC_NAME=C
 [9] LC_ADDRESS=C               LC_TELEPHONE=C
[11] LC_MEASUREMENT=en_US.UTF-8 LC_IDENTIFICATION=C

attached base packages:
[1] parallel  stats     graphics  grDevices utils     datasets  methods
[8] base

other attached packages:
[1] Biobase_2.38.0      BiocGenerics_0.24.0 RColorBrewer_1.1-2
[4] wesanderson_0.3.2   cowplot_0.8.0       ggplot2_2.2.1
[7] dplyr_0.7.0         data.table_1.10.4

loaded via a namespace (and not attached):
 [1] Rcpp_0.12.14     knitr_1.16       magrittr_1.5     munsell_0.4.3
 [5] colorspace_1.3-2 R6_2.2.0         rlang_0.1.2      stringr_1.2.0
 [9] plyr_1.8.4       tools_3.4.1      grid_3.4.1       gtable_0.2.0
[13] git2r_0.19.0     htmltools_0.3.6  lazyeval_0.2.0   yaml_2.1.14
[17] rprojroot_1.2    digest_0.6.12    assertthat_0.1   tibble_1.3.3
[21] glue_1.1.1       evaluate_0.10.1  rmarkdown_1.6    labeling_0.3
[25] stringi_1.1.2    compiler_3.4.1   scales_0.4.1     backports_1.0.5
This R Markdown site was created with workflowr