Compares gene annotations between two different cell time types
Joyce Hsiao
Last updated: 2018-07-16
Code version: 20b2161
Goals
Consider top X cyclical genes, check GO categories.
Examine number of genes selected at top X cut-offs: Across cut-offs, more selected when cyclical trend is based on fucci time instead of fucci + dapi time.
Compare the prediction error patterns between these two scenarios. While both are higher than when the expression data is used to predict random cell time lables, the effect of adding more genes is quite different on prediction error. When the cyclical genes are learned from fucci times, there appears to be roughly an increase of .01 between top 5 and top 100 genes prediction. On the contrary, when the cyclical genes are learned from fucci-times, there appears to be roughly a decrease of .01 between top 5 and top 100 gene prediction.
It is possible that the cell times based on fucci and dapi does not reflect the cell time ordering accurately. The PCs based on FUCCI and DAPI form an ellipse rather than a circle. Hence I am re-running the analysis using a different data transformation that account for the fact that the PC1 and PC2 form an ellipse rather than a circle.
In terms of GO annotation, there’s not much difference between the two. Both have 37 genes found to be related to the Cell Cycle GO term (0007049).
Retrieve gene lists
genes_list <- readRDS(file = "../data/results/results_topgenes.rds")
genes_list_triple <- readRDS(file = "../data/results/triple_results_topgenes.rds")

all_genes <- genes_list[length(genes_list)][[1]]

library(biomaRt)
ensembl <- useMart(biomart = "ensembl", dataset = "hsapiens_gene_ensembl")
symbols <- getBM(attributes = c("hgnc_symbol",'ensembl_gene_id'),
      filters = c('ensembl_gene_id'),
      values = all_genes,
      mart = ensembl)

# get gene symbols for gene list under fucci cell time prediction
genes_list_symbols <- lapply(1:length(genes_list), function(i) {
  ll <- genes_list[i][[1]]
  #symbols[match(ll,symbols$ensembl_gene_id),]
  symbs <- symbols[which(symbols$ensembl_gene_id %in% ll),]
  non_symbs <- ll[which(!(ll %in% symbols$ensembl_gene_id))]
  df_non_symbs <- data.frame(hgnc_symbol=NA,
                             ensembl_gene_id=non_symbs)
  out <- rbind(symbs, df_non_symbs)
  out <- out[match(ll,out$ensembl_gene_id),]
  return(out)
})
names(genes_list_symbols) <- names(genes_list)

# get gene symbols for gene list under fucci and dapi cell time prediction
genes_list_symbols_triple <- lapply(1:length(genes_list_triple), function(i) {
  ll <- genes_list_triple[i][[1]]
  #symbols[match(ll,symbols$ensembl_gene_id),]
  symbs <- symbols[which(symbols$ensembl_gene_id %in% ll),]
  non_symbs <- ll[which(!(ll %in% symbols$ensembl_gene_id))]
  if (length(non_symbs)==0) {
    out <- symbs
  }
  if (length(non_symbs)>0) {
    df_non_symbs <- data.frame(hgnc_symbol=NA,
                           ensembl_gene_id=non_symbs)
    out <- rbind(symbs, df_non_symbs)
  }
  out <- out[match(ll,out$ensembl_gene_id),]
  return(out)
})
names(genes_list_symbols_triple) <- names(genes_list_triple)

saveRDS(genes_list_symbols,
        "../output/method-train-genes-fucci-vs-triple.Rmd/genes_list_symbols.rds")
saveRDS(genes_list_symbols_triple,
        "../output/method-train-genes-fucci-vs-triple.Rmd/genes_list_symbols_triple.rds")
Overlap with each other
genes_list <- readRDS(file = "../data/results/results_topgenes.rds")
genes_list_triple <- readRDS(file = "../data/results/triple_results_topgenes.rds")

both_overlap <- sapply(1:length(genes_list), function(i) {
  overlap_genes <- intersect(genes_list[[i]],genes_list_triple[[i]])
  length(overlap_genes)
})

par(mfrow=c(1,2))
plot(x=names(genes_list)[1:21],
     y=both_overlap[1:21], ylim=c(0,100),
     xlab="Top X cyclical genes",
     ylab="Number of selected genes")
points(x=names(genes_list)[1:21],
       y=sapply(genes_list, length)[1:21], col="blue", pch=16, cex=.7)
points(x=names(genes_list_triple)[1:21],
       y=sapply(genes_list_triple, length)[1:21], col="forestgreen", pch=16, cex=.7)
legend("topleft", legend=c("both", "fucci", "triple"),
       col=c("black", "blue", "forestgreen"), pch=1)

plot(x=names(genes_list)[1:11],
     y=both_overlap[1:11], ylim=c(0,60),
     xlab="Top X cyclical genes",
     ylab="Number of selected genes")
points(x=names(genes_list)[1:11],
       y=sapply(genes_list, length)[1:11], col="blue", pch=16, cex=.7)
points(x=names(genes_list_triple)[1:11],
       y=sapply(genes_list_triple, length)[1:11], col="forestgreen", pch=16, cex=.7)
title("Overlap between selected genes", outer=TRUE, line=-1)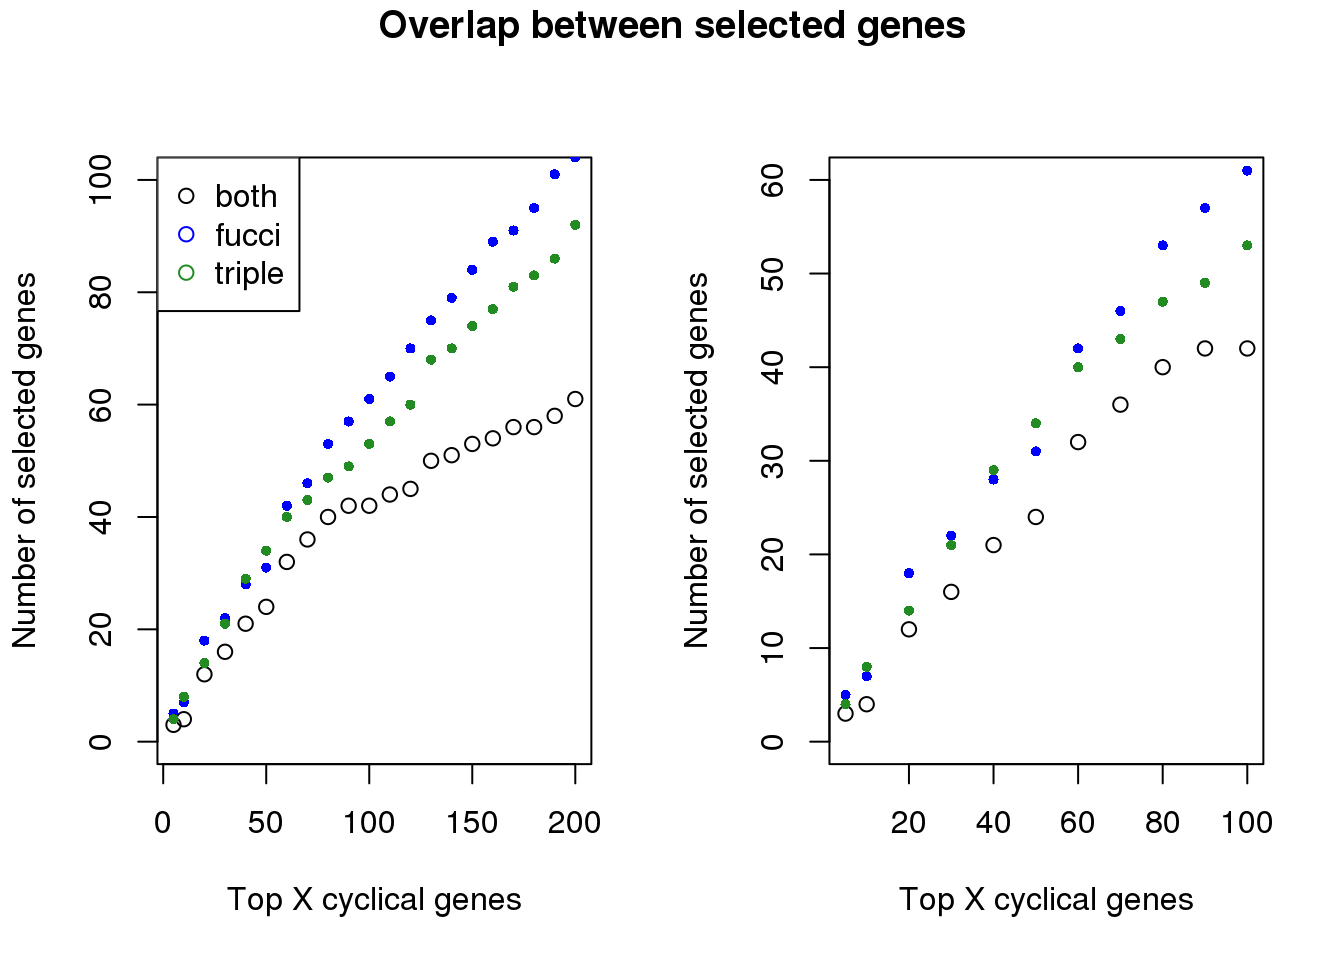
Overlap with Seurat genes
genes_list <- readRDS(file = "../data/results/results_topgenes.rds")
genes_list_triple <- readRDS(file = "../data/results/triple_results_topgenes.rds")
genes_list_symbols <- readRDS("../output/method-train-genes-fucci-vs-triple.Rmd/genes_list_symbols.rds")
genes_list_symbols_triple <- readRDS("../output/method-train-genes-fucci-vs-triple.Rmd/genes_list_symbols_triple.rds")

seurat.genes <- readLines(
  con = "../data/cellcycle-genes-previous-studies/seurat_cellcycle/regev_lab_cell_cycle_genes.txt")
seurat.genes <- list(s.genes=seurat.genes[1:43],
                     g2m.genes=seurat.genes[44:97])


double_overlap  <- sapply(genes_list_symbols, function(x) sum(x$hgnc_symbol %in% unlist(seurat.genes)))
triple_overlap  <- sapply(genes_list_symbols_triple, function(x) sum(x$hgnc_symbol %in% unlist(seurat.genes)))

par(mfrow=c(1,2))
plot(x=names(genes_list)[1:40],
     sapply(genes_list, length)[1:40],
     xlab="Top X cyclical genes",
     ylab="Number of selected genes",
     main = "Up to top 400")
points(x=names(genes_list_triple)[1:40],
          sapply(genes_list_triple, length)[1:40], col="blue", pch=1)
legend("topleft", pch=1, col=c("black", "blue"),
       legend=c("fucci time", "fucci and dapi time"))
plot(x=names(genes_list)[1:11],
     sapply(genes_list, length)[1:11],
     xlab="Top X cyclical genes",
     ylab="Number of selected genes",
     main = "Up to to 100", ylim=c(0, 65))
points(x=names(genes_list_triple)[1:11],
          sapply(genes_list_triple, length)[1:11], col="blue", pch=1)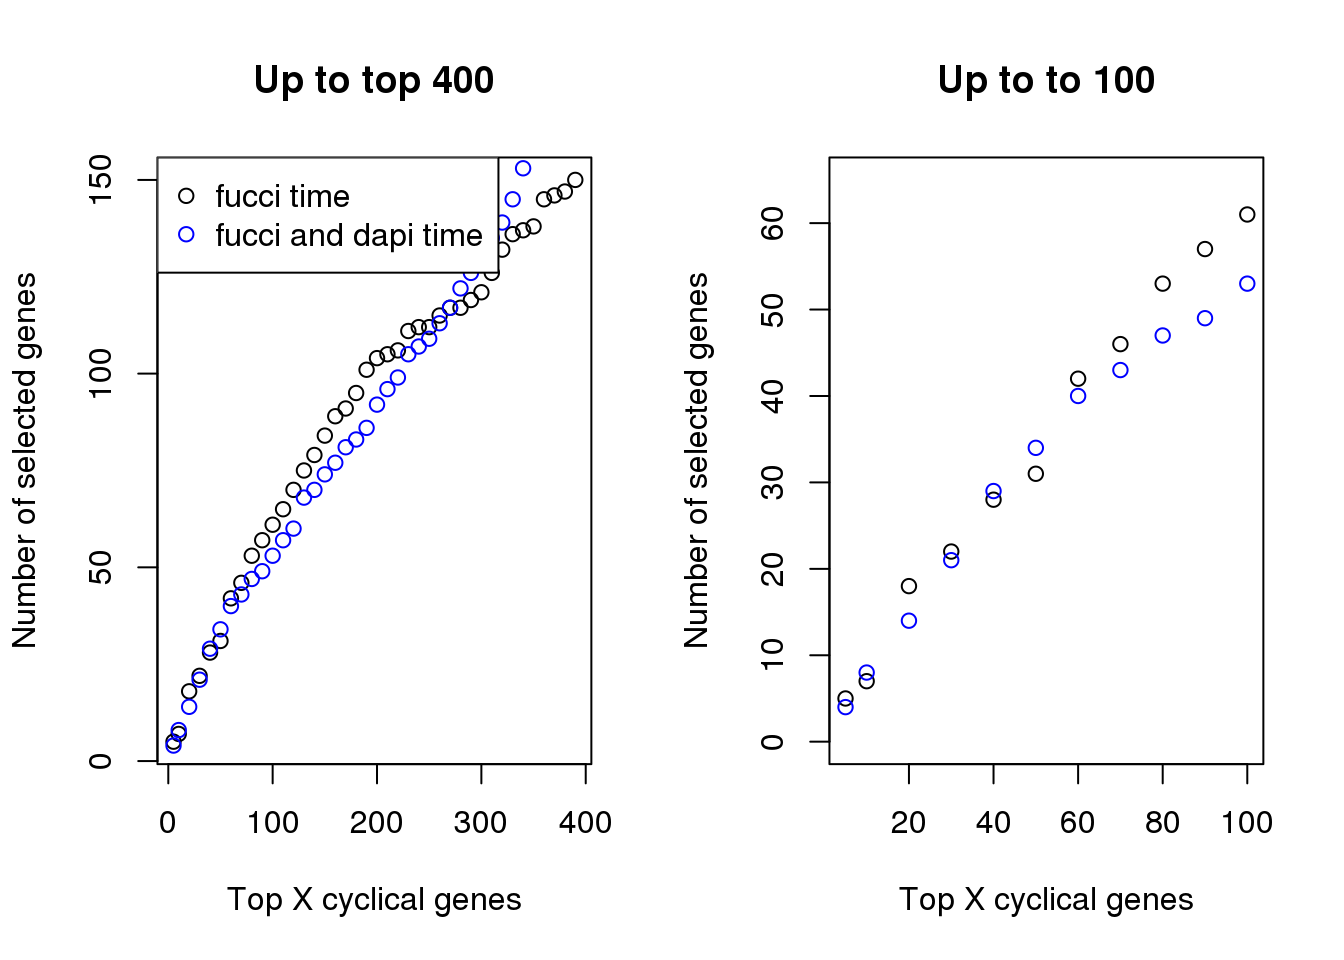
par(mfrow=c(1,2))
plot(x=names(genes_list)[1:40],
     double_overlap[1:40],
     xlab="Top X cyclical genes",
     ylab="Number of Seurat genes (total 92 detected)",
     main = "Up to top 400", ylim=c(0,80))
points(x=names(genes_list_triple)[1:40],
          triple_overlap[1:40], col="blue", pch=1)
legend("topleft", pch=1, col=c("black", "blue"),
       legend=c("fucci time", "fucci and dapi time"))

plot(x=names(genes_list)[1:11],
     double_overlap[1:11],
     xlab="Top X cyclical genes",
     ylab="Number of Seurat genes (total 92 detected)",
     main = "Up to top 100", ylim=c(0,30))
points(x=names(genes_list_triple)[1:11],
          triple_overlap[1:11], col="blue", pch=1)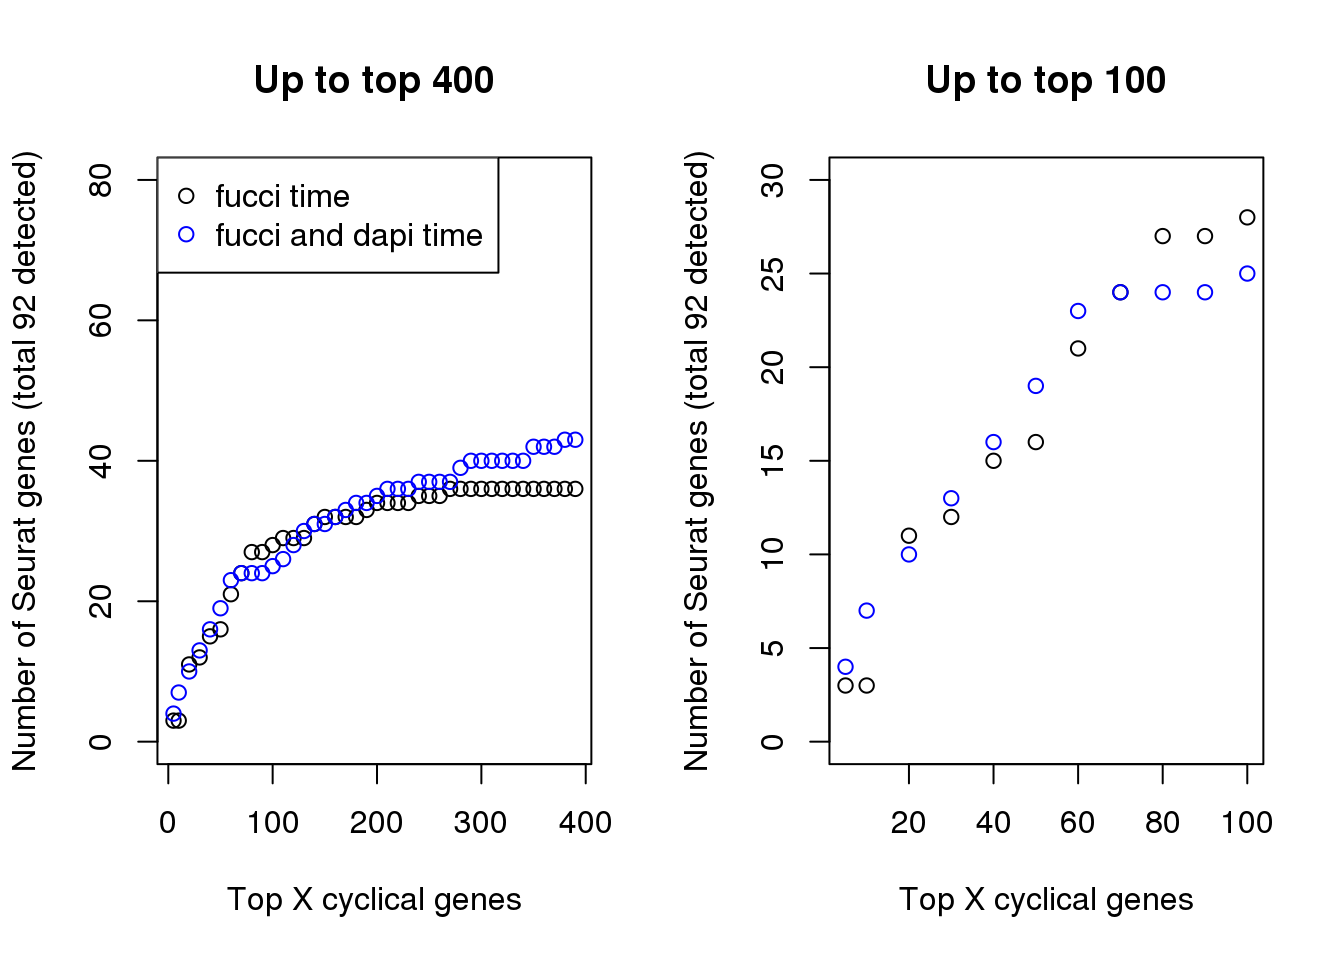
Save top 100 genes symbols to output table
write.table(genes_list_symbols[[11]]$hgnc_symbol,
            file = "../output/method-train-genes-fucci-vs-triple.Rmd/topgenes.txt",
            row.names=F,
            col.names=F, quote=F)

write.table(genes_list_symbols_triple[[11]]$hgnc_symbol,
            file = "../output/method-train-genes-fucci-vs-triple.Rmd/triple_topgenes.txt",
            row.names=F,
            col.names=F, quote=F)

write.table(genes_list_symbols[[length(genes_list_symbols)]][,1],
            file = "../output/method-train-genes-fucci-vs-triple.Rmd/allgenes.txt",
            row.names=F,
            col.names=F, quote=F)
Session information
sessionInfo()R version 3.4.3 (2017-11-30)
Platform: x86_64-pc-linux-gnu (64-bit)
Running under: Scientific Linux 7.4 (Nitrogen)
Matrix products: default
BLAS/LAPACK: /software/openblas-0.2.19-el7-x86_64/lib/libopenblas_haswellp-r0.2.19.so
locale:
[1] LC_CTYPE=en_US.UTF-8 LC_NUMERIC=C
[3] LC_TIME=en_US.UTF-8 LC_COLLATE=en_US.UTF-8
[5] LC_MONETARY=en_US.UTF-8 LC_MESSAGES=en_US.UTF-8
[7] LC_PAPER=en_US.UTF-8 LC_NAME=C
[9] LC_ADDRESS=C LC_TELEPHONE=C
[11] LC_MEASUREMENT=en_US.UTF-8 LC_IDENTIFICATION=C
attached base packages:
[1] stats graphics grDevices utils datasets methods base
loaded via a namespace (and not attached):
[1] compiler_3.4.3 backports_1.1.2 magrittr_1.5 rprojroot_1.3-2
[5] tools_3.4.3 htmltools_0.3.6 yaml_2.1.16 Rcpp_0.12.17
[9] stringi_1.1.6 rmarkdown_1.10 knitr_1.20 git2r_0.21.0
[13] stringr_1.2.0 digest_0.6.15 evaluate_0.10.1This R Markdown site was created with workflowr