Select cell cycle genes
Joyce Hsiao
Last updated: 2018-02-28
Code version: 4131ce7
Overview
Select genes annotated to cell cycle in the GO annotation (GO:0007049).
Select genes documented in CycleBase - previously found to relate to cell cycle in microarray studies.
Select genes whose expression variability is above certain threshold.
This document generated several RDS for later use:
*genes.go.rds: 677 human cell cycle genes associated with GO:0007049
*genes.detect.rds: 6313 genes in the current study with detection rate > 50%
*genes.go.detect.rds: 450 genes in the current study with detection rate > 50% and associated with GO:0007049
*genes.variable.rds: 359 genes in the current study with detection rate > 50% and dispersion z-score > 1.5 across expression mean bins
*genes.go.variable.rds: 24 genes in the current study with detection rate > 50% and dispersion z-score > 1.5 across expression mean bins and associated with GO:0007049
Data and packages
Packages
library(biomaRt)
library(Biobase)
Load data
df <- readRDS(file="../data/eset-filtered.rds")
pdata <- pData(df)
fdata <- fData(df)

# select endogeneous genes
counts <- exprs(df)[grep("ENSG", rownames(df)), ]
GO cell cycle
ensembl = useMart("ensembl",dataset="hsapiens_gene_ensembl")
#gets gene symbol, transcript_id and go_id for all genes annotated with GO:0007507
genes.go <- getBM(attributes=c('hgnc_symbol', 'ensembl_gene_id', 'go_id'),
                   filters = 'go', values = 'GO:0007049', mart = ensembl)
genes.go <- unique(genes.go$ensembl_gene_id)
Variable genes
Across individuals, I computed gene mean and coefficient of variation including cells that are detected as expressed for each gene.
gene.means <- apply(counts, 1, function(x) {
  ii_pos <- x >0
  mean(x[ii_pos])
})


gene.cvs <- apply(counts, 1, function(x) {
  ii_pos <- x >0
  mn <- mean(x[ii_pos])
  sd <- sd(x[ii_pos])
  sd/mn
})

gene.drops <- rowMeans(counts>0)
Relationship between gene mean and CV is the same as we observed before in the batch paper. The genes with low average expression across cells are those that have high dropout rate.
par(mfrow=c(1,2))
plot(x=log10(gene.means), y = gene.cvs,
     xlab = "log10 gene mean count", ylab = "CV")
abline(v=.25, col = "red")
plot(x=gene.drops, y = log10(gene.means),
     xlab = "Proportion of samples detected (count 0)",
     ylab = "log10 gene mean count")
abline(v=.5, col = "blue")
abline(h=.25, col = "red")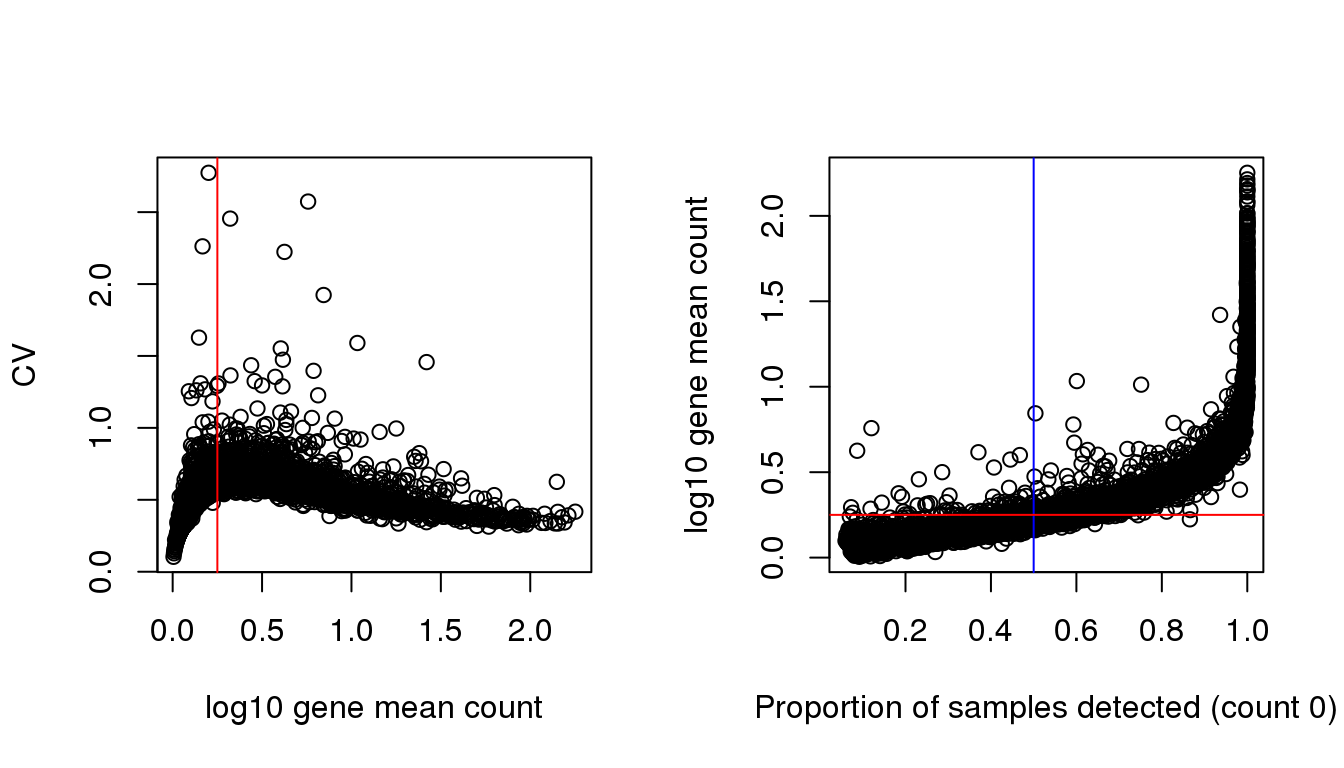
Two steps here for choosing variable genes:
I arbitrary decided on a cutoff for gene mean based on the relationship between CV and log10 gene count. The idea was to filter the genes among which dispersion increases with gene mean (approximately when detection rate 50% or lower).
Scan across gene expression bins, identify the ones with high variability in each bin.
genes.detect <- rownames(counts)[which(gene.drops > .5)]

gene.means.detect <- gene.means[which(gene.drops > .5)]
gene.cvs.detect <- gene.cvs[which(gene.drops > .5)]

bins <- cut(gene.means.detect,
            breaks = quantile(gene.means.detect, prob = seq(0,1, .05)),
            include.lowest = TRUE)
bins <- as.numeric(bins)

genes.variable <- do.call(c, lapply(1:length(bins), function(i) {
  ii_bin <- bins == i
  cv.z <- scale(gene.cvs.detect[ii_bin])
  rownames(cv.z)[which(cv.z>1.5)]
}) )

plot(x=log10(gene.means.detect),
     y=gene.cvs.detect,
     xlab = "log10 gene mean count",
     ylab = "CV", main = "Genes detected in > 50% cells",
     col = 1+as.numeric(names(gene.means.detect) %in% genes.variable))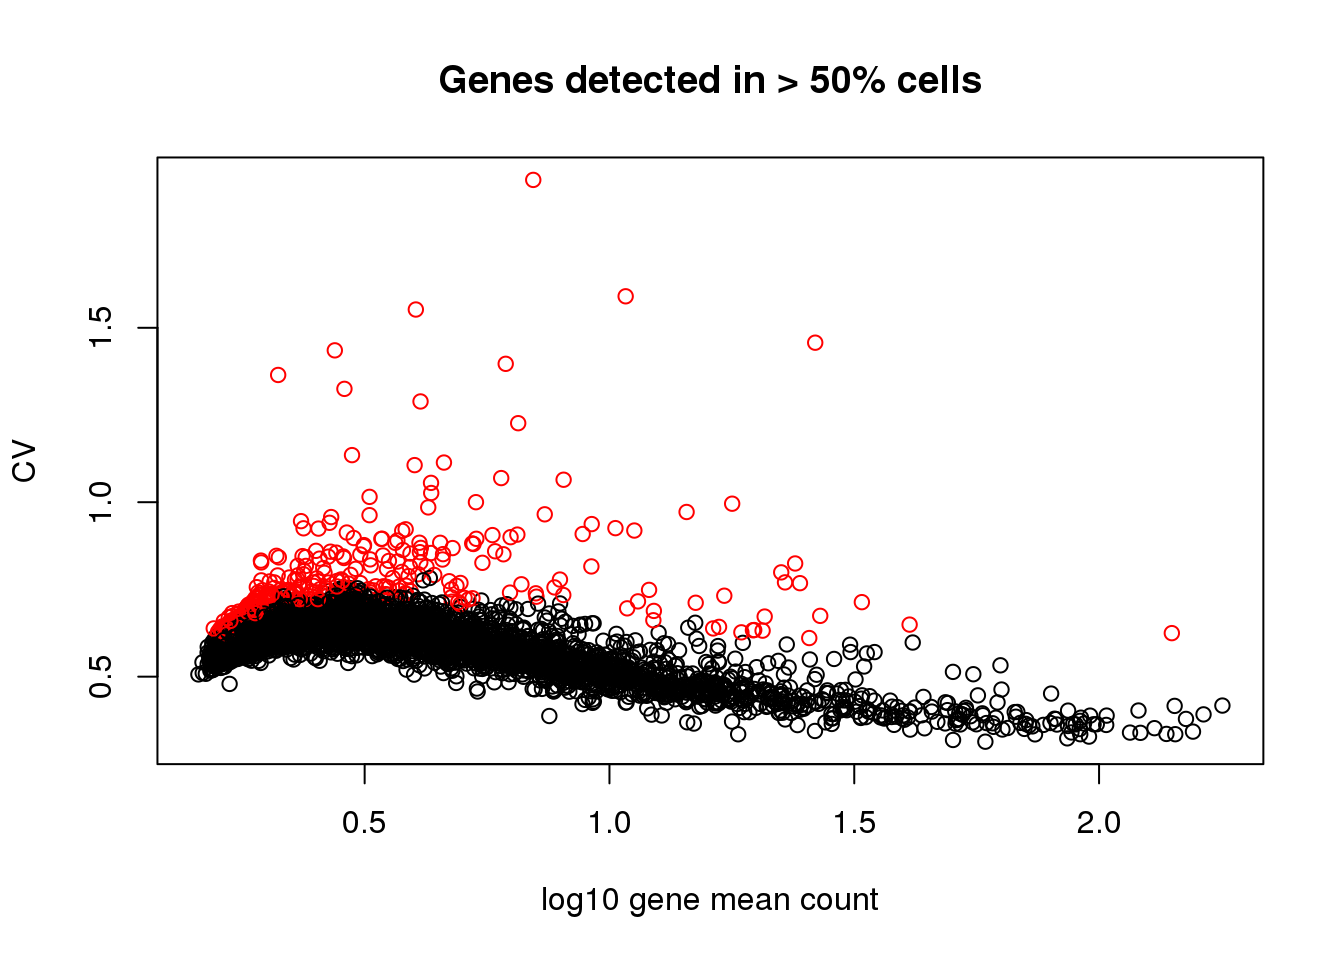
Output
saveRDS(genes.go,
        file = "../output/seqdata-select-cellcyclegenes.Rmd/genes.go.rds")
saveRDS(genes.variable,
        file = "../output/seqdata-select-cellcyclegenes.Rmd/genes.variable.rds")

saveRDS(genes.detect,
        file = "../output/seqdata-select-cellcyclegenes.Rmd/genes.detect.rds")

genes.go.detect <- genes.detect[which(genes.detect %in% genes.go)]
saveRDS(genes.go.detect,
        file = "../output/seqdata-select-cellcyclegenes.Rmd/genes.go.detect.rds")

genes.go.variable <- genes.variable[which(genes.variable %in% genes.go)]
saveRDS(genes.go.variable,
        file = "../output/seqdata-select-cellcyclegenes.Rmd/genes.go.variable.rds")
Session information
R version 3.4.1 (2017-06-30)
Platform: x86_64-redhat-linux-gnu (64-bit)
Running under: Scientific Linux 7.2 (Nitrogen)

Matrix products: default
BLAS/LAPACK: /usr/lib64/R/lib/libRblas.so

locale:
 [1] LC_CTYPE=en_US.UTF-8       LC_NUMERIC=C
 [3] LC_TIME=en_US.UTF-8        LC_COLLATE=en_US.UTF-8
 [5] LC_MONETARY=en_US.UTF-8    LC_MESSAGES=en_US.UTF-8
 [7] LC_PAPER=en_US.UTF-8       LC_NAME=C
 [9] LC_ADDRESS=C               LC_TELEPHONE=C
[11] LC_MEASUREMENT=en_US.UTF-8 LC_IDENTIFICATION=C

attached base packages:
[1] parallel  stats     graphics  grDevices utils     datasets  methods
[8] base

other attached packages:
[1] Biobase_2.38.0      BiocGenerics_0.24.0 biomaRt_2.34.2

loaded via a namespace (and not attached):
 [1] Rcpp_0.12.15         AnnotationDbi_1.40.0 knitr_1.20
 [4] magrittr_1.5         progress_1.1.2       IRanges_2.12.0
 [7] bit_1.1-12           R6_2.2.2             rlang_0.2.0
[10] httr_1.3.1           stringr_1.3.0        blob_1.1.0
[13] tools_3.4.1          DBI_0.7              git2r_0.21.0
[16] htmltools_0.3.6      assertthat_0.2.0     yaml_2.1.16
[19] bit64_0.9-7          rprojroot_1.3-2      digest_0.6.15
[22] tibble_1.4.2         S4Vectors_0.16.0     bitops_1.0-6
[25] curl_3.1             RCurl_1.95-4.10      memoise_1.1.0
[28] evaluate_0.10.1      RSQLite_2.0          rmarkdown_1.8
[31] stringi_1.1.6        pillar_1.1.0         compiler_3.4.1
[34] prettyunits_1.0.2    backports_1.1.2      stats4_3.4.1
[37] XML_3.98-1.10
This R Markdown site was created with workflowr